1. Overview.
Colour vision processing in the primate visual system is initiated by absorption of light by three different spectral classes of cones. Consequently, colour vision is described as being trivariant or trichromatic, and initial psychophysical studies demonstrated that colours could be matched by the use of three different primaries. In 1802, Thomas Young proposed a model that perception of colour can be coded by three principal colour receptors rather than thousands of colour receptors coding for individual colours.
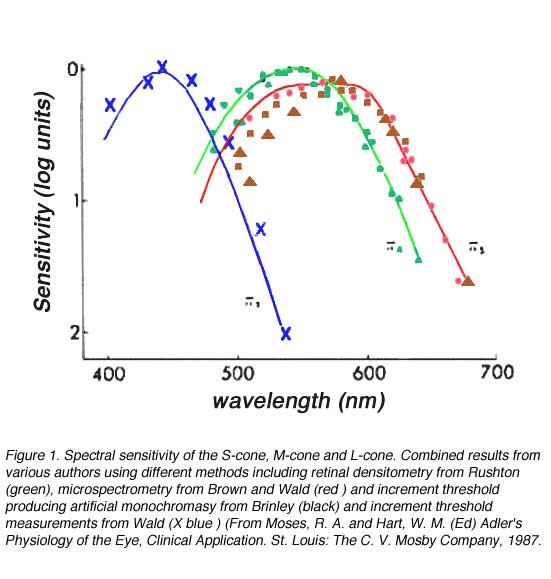
Spectral sensitivity of cones can be determined through several methods. Two of these methods include isolating receptoral responses (Baylor et al, 1984) using calculation from colour matching function of normals and dichromats (Smith and Pokorny, 1975; a dichromat is a subject whose retina has one cone photopigment missing), microspectrometry (Bowmaker and Dartnall, 1980) or reflection densitometry (Rushton, 1963, 1966). The microspectrometer technique involves isolating a single cone and passing light through it. The change in transmission of different wavelengths can be used to calculated the spectral absorption of the cone or determine the change in electrical response. Reflection densitometry involves directing light in the retina and determining the change in absorption as a function of wavelength. These results are subsequently used to calculate spectral absorption.
Three classes of cones in the human retina have been isolated from the above techniques. These three classes of cones are the short-wavelength sensitive (S-cones), middle-wavelength sensitive (M-cones) and long-wavelength sensitive (L-cones), and all have different but overlapping spectral sensitivities. The spectral sensitivity of S-cones peak at approximately 440 nm, M-cones peak at 545 nm and L-cones peak at 565 nm after corrected for pre-retinal light loss, although the various measuring techniques result in slightly different maximum sensitivity values (figure 1).
Colour Matches
The trichromatic nature of colour vision will enable almost any colour to be matched by a mixture of three colours. This trichromacy of vision is also linear. This means that colorimetric equations has properties of an ordinary equation.
The colour matches of quantity Cs of a stimulus S can be expressed as:
Cs(S) = C1(l1) + C2(l2) + C3(l3)
where li are the three primary colours (not necessarily monochromatic spectral colours) and Ci are tristimulus values.
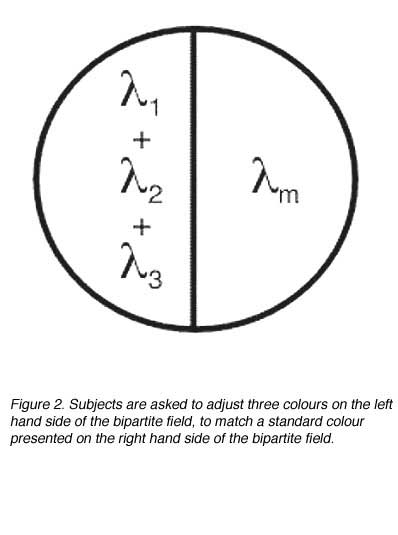
Tristimulus values represent the quantities of each of the three primaries necessary to achieve a match for colour and luminosity (figure 2). They can be expressed in units of luminous flux or radiant flux, or even an arbitrary scale provided that the arbitrary scale conveys the relative proportions of the three quantities.
Additive and Subtractive Colour Mixtures
Two or more colours can be added together to produce a new colour composed of the mixture of the initial colours used. This can be demonstrated on a white screen with three colours: blue, green and red. Cyan, magenta, yellow and white are formed from the mixture of these colours (figure 3). One of the requirements in choosing colours to be used in colour mixing experiments is that two of them cannot be mixed to produce the third.

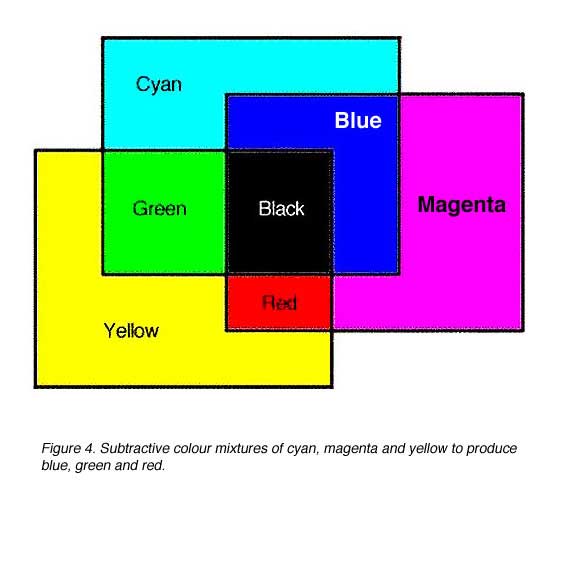
Subtractive colour mixtures involve the selectively absorption of wavelengths. Cyan, magenta and yellow are subtractive primaries. If white light was shone through a yellow filter, the yellow filter will absorb blue and transmit red and green (which makes yellow). Therefore, yellow can be considered as a -B filter. A magenta filter subtracts or absorbs green (-G filter) from white light and cyan subtracts or absorbs red (-R filter) from white light (figure 4).
Grassmann’s Laws provide a quantitative description of colour matching data (Grassman 1855). They hold up well within a prescribed set of conditions (with respect to brightness, adaptation of the observer, size of the field, etc). Grassmann’s Laws are useful in quantifying colour matching data, but as a rule, colour matching data are affected by the following:
- macular pigment (xanthophyll) variations in subject’s central 4 – 5 degrees of vision
- chromatic aberrations
- rod intrusion, especially when large fields and low photopic light levels are involved
- failure of Abney’s Law of luminance additivity including the Helmholtz-Kohlrausch effect
- Bezold-Brücke hue shift at bright intensities
2. Color Specification.
The Munsell Colour System
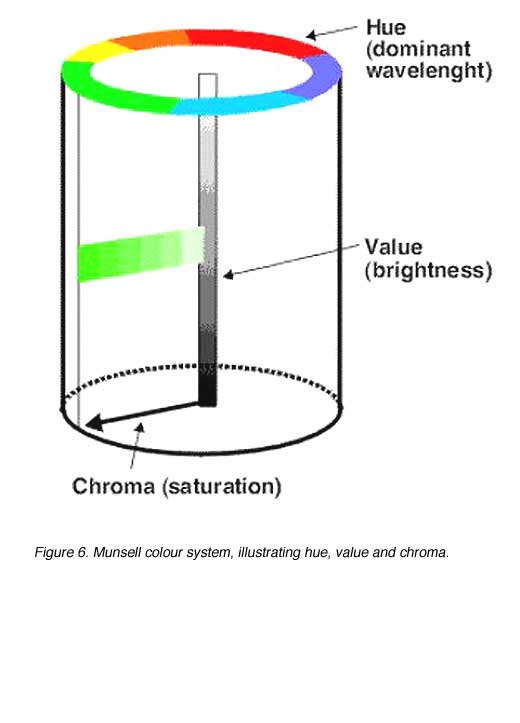
All colours can be fully specified in terms of their hue, lightness and saturation. The Munsell system has three dimensions: hue, value and chroma. These three dimensions correspond to the three perceptual attributes of human colour vision.
The three dimensions of the Munsell colour system are:
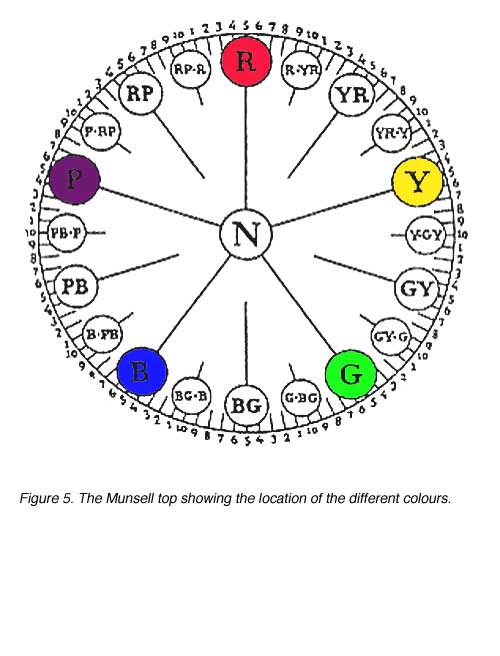
1. Hue: Related to wavelength or dominant wavelength. Hue is denoted by a combination of letters and numbers making up a 100 step scale (figure 5). There are ten letter categories used to denote hue, with each of these further subdivided (by the use of numerals 1 to 10) into ten subgroups. If the numeral denoting the hue subgroup is 5, then it can be omitted (eg. 5R is the same hue as R).
2. Value: Value is specified on a numerical scale from 1 (black) to 10 (white) and this attribute is related to reflectance and luminosity (or lightness).
3. Chroma: Chroma is the Munsell term corresponding to saturation. It is indicated numerically on a scale of 0 to the various maxima dependent on the saturation obtainable with available pig ments.
For example, a colour may have a notation 2GY 6/10. This means it is a green/yellow that is quite close to being a yellow; it has a value of 6 (ie. almost midway in the black/white scale) and a chroma of 10 (ie. it is saturated).
The scaling used in the Munsell system is designed to be perceptually uniform. In another words, the colour samples are arranged in equal visual steps. For example, the perceived difference between a chroma of 3 and a chroma of 4 is (nominally) the same as the perceived difference between chroma 4 and 5. This scaling is the same for all three dimensions, although step sizes along different dimensions are not comparable (that is, a single step difference in hue does not have the same perceptual difference as a single step in saturation).
A schematic representation of the Munsell system is shown in figure 6. The value scale is on the vertical axis, the hue scale is on the perimeter of the cylinder and chroma is on a radial scale. The Munsell top, shown in Figure 5, is a more precise representation of this concept.
1931 Commision Internationale d’Elairage (CIE) chromaticity system
Trichromatic colour matches using three colours can be illustrated on NewtonÕs colour circle (figure 7). Newton’s colour circle consists of the following components:
- a circle representing the spectral colours (although not shown here, mixtures of blue and red (purple locus are not spectral colours and hence a straight line between R and B is more appropriate)
- a triangle whose vertices represent the three primary colours used to make colour matches (R, G and B)
- the centre of the circle representing white (W)
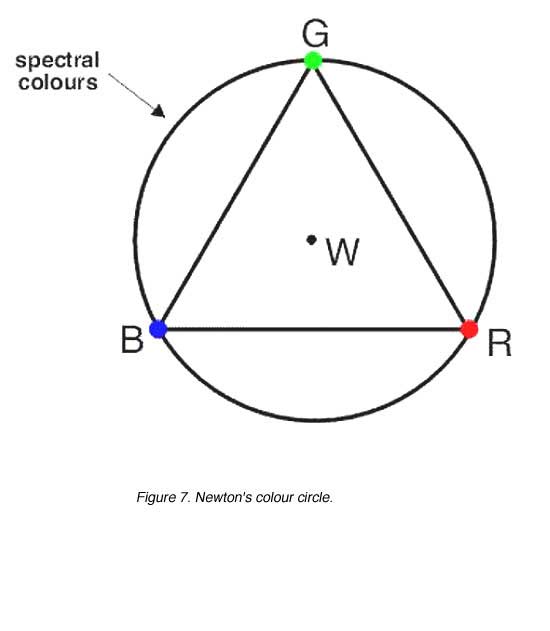
Newton’s colour circle provides a qualitative description of colour matches and can be used to explain why two colours may not be sufficient to make colour matches and also the use of ‘negative’ colours. For example, if 500 nm is required to be matched (spectral colour located on the circle), blue and green will be required. However, blue and green primaries alone will produce a desaturated 500 nm. Therefore, red must be added to the spectral colour to desaturate it and make the match (figure 8) When the third primary is added to desaturate the colour mixture, negative tristimulus values result (figure 5). This can be demonstrated by the following equation:
500 nm (S) + R º G+ B
or
500 nm (S) º G + B – R

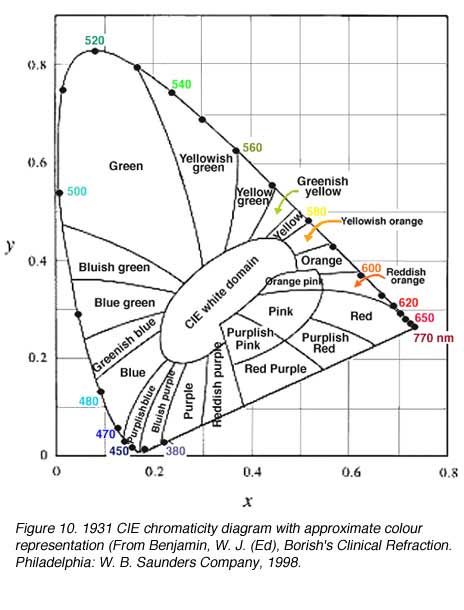
In order to deal with the ‘negative’ colours, the CIE devised the XYZ system that uses unreal (imaginary) primaries to describe colour space. The 1931 CIE chromaticity system chose three imaginary primaries (reference stimuli) X, Y and Z, so that all spectral loci lying inside this triangle will be positive. The alychne are locus of colours with no luminosity and this was chosen to lie along the X to Z on the XYZ chromaticity system. All luminosity is expressed in Y. The reference loci of Y was chosen to just enclose the domain of real colours. Equi-energy white was chosen to have equal chromaticity co-ordinates, that is, 0.33, 0.33 (figure 9 and 10). Chromaticity co-ordinates represents the relative contribution of the three primaries, the sum of the co-ordinates equals 1.0. Therefore, z can be calculated, by knowing the co-ordinates x and y since x + y + z = 1.
 |  |
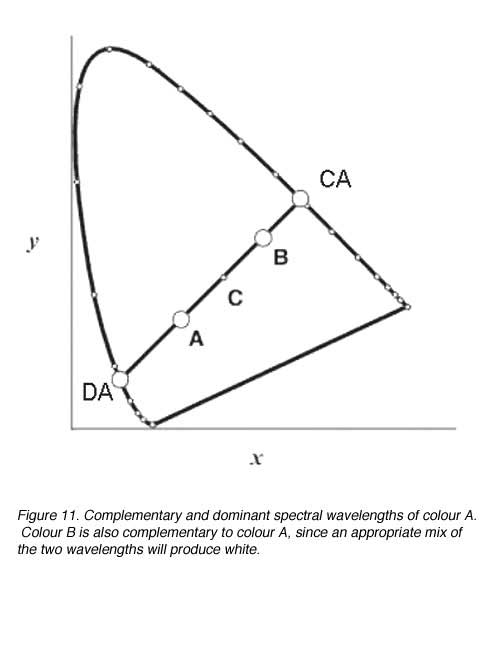
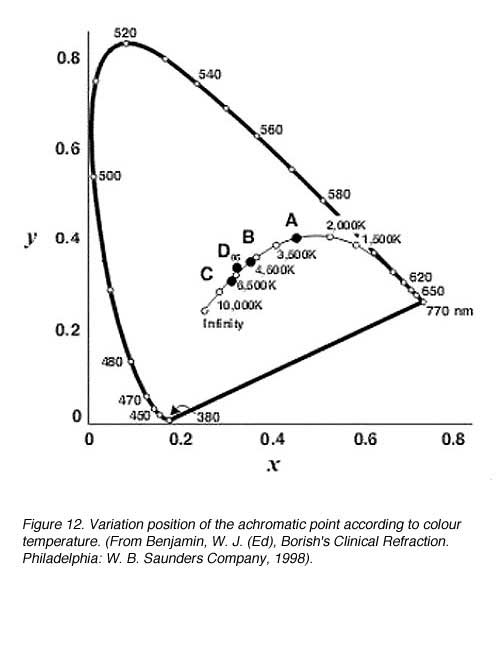
Dominant wavelength, complementary wavelength and excitation purity can be easily located for a sample. The dominant wavelength represents the principle wavelength of the colour. The complementary wavelength is the wavelength that produces white when mixed in appropriate portions with the dominant wavelength. Spectral complementaries can be found when a line joined by a lines which passes through the achromatic point shown as C (figure 11). The dominant wavelength of A is given by the spectral wavelength at DA and the complementary by the wavelength at CA (figure 11). Point C identifies the location of the white point and B identifies another wavelength, that when mixed at the appropriate proportions, will produce white.
 The achromatic point varies depending upon the standard illuminant that is used (figure 12). A shift in the x and y co-ordinates occurs as colour temperature increases. For standard illuminant C, there is no complimentary wavelengths for green (between wavelengths 492 nm to 567 nm) However, white light can be formed with a suitably chosen purple light (figure 12).
3.Colour Discrimination Functions.
The three variables in colour vision, hue, saturation and brightness, all depend on wavelength. Colour discrimination experiments allow us to know how much change in wavelength is required to detect a difference in hue, saturation and brightness.
Hue discrimination describe the amount of change in wavelength (l + D l) that is required to be able detect a change in hue. For blue and red light, a large change in wavelength is required to detect a change in hue while less than 2 nm change in wavelength is needed for most of the spectrum for a person with normal colour vision (figure 13).
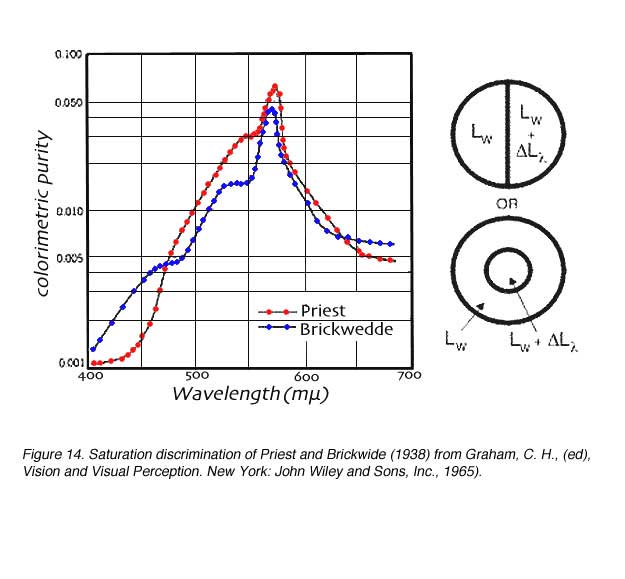
 Saturation discrimination describes the degree of paleness of the colour. Saturation is related to colorimetric purity (P) which is also defined as:
P= L/(Lw+L)
where L is the luminance of the spectral colour and Lw is the luminance of the white that is mixed with the spectral colour. The colorimetric purity of a colour quantifies the amount of white mixed with the spectral colour. If the spectral colour is pure (no white added), then the colorimetric purity is 1.
In saturation discrimination experiments, the luminance is kept constant. A bipartate field is used with white (Lw) on one side and white mixed with the spectral colour on the other side (Lw + D L). In can be seen in figure 14, that more 570 nm colour is required to make the white patch appear coloured. Therefore, yellow has low saturating power, whereas blue and red have high saturation power.
The V(l ) function closely matches the sensation of brightness and hence is commonly considered to reflect brightness discrimination. The wavelength 555 nm is perceived as the brightest in the colour spectrum (see earlier section on the photopic and scotopic luminosity function).
4.Theories of Colour Vision.
Any theory of colour vision must predict all the perceptual attributes noted earlier. We present here a simplistic view of the trichromatic and colour opponent theories. See the Colour Vision section by Peter Gouras for a discussion on the physiological correlate of colour opponency.
The trichromatic theory was first proposed by Thomas Young in 1802 and was explored further by Helmholtz in 1866. This theory is primarily based on colour mixing experiment and suggests that a combination of three channels explain colour discrimination functions.
Evidence for the trichromatic theory includes:
- Identification of the spectral sensitivities of two cone pigments by Rushton’s retinal densitometry (Rushton, 1963).
- Identification of three cone pigments by microspectrometry (Marks, Dobelle and MacNichol, 1964).
- Identification of the genetic code for L, M and S cones (Nathans et al, 1986a,b).
- Colour matching functions.
- Isolating photoreceptors and measuring their physiological repsonses as a function of wavelength (Baylor et al, 1984).
- Spectral sensitivity measurements (Wald-Marre spectral sensitivity functions and Stiles’ p -mechanisms)
However, the trichomatic theory fails to account for the four unique colours: red, green, yellow and blue, and also fails to explain why dichromats can perceive white and yellow. It also fails to fully explain colour discrimination functions and opponent colour percepts.
The opponent colour theory was first proposed by Hering in 1872. At the time, this theory rivalled the well accepted trichromatic theory which explains the trichromasy of vision and predicts colour matches. Hering’s opponent colour theory suggests that there are three channels: red-green, blue-yellow and black-white, with each responding in an antagonist way. That is, either red or green is perceived and never greenish-red. Hering, however, never challenged the initial stages of processing expressed by the trichromatic theory. He simply argued that any colour vision theory should explain our perception, that is, colour opponency as revealed by coloured after images.
Hurvich and Jameson (1957) provided quantitative data for colour opponency. Using hue cancellation paradigms, the psychophysical colour opponent channels were isolated. The Vl function was used to brightness discrimination to describe the perception of blackness and whiteness. Therefore, by adjusting the amount of blue or yellow AND red or green, any sample wavelength can be matched (figure 15). Complementary wavelengths can be used to cancel each other for all wavelengths except the four unique hues (blue, green, yellow and red).

Other evidence supporting the opponent colour theory include:
- Electrical recordings of horizontal cells from fish retina show blue-yellow opponent process and red-green opponent (Svaetichin, 1956).
- Electrical recording from the lateral geniculate nucleus showing opponent colour processes (DeValois et al, 1966).
- Electrical recording of ganglion cells from primate retina showing opponent colour processes (Gouras, 1968; de Monasterio and Gouras, 1975; Zrenner and Gouras, 1981).
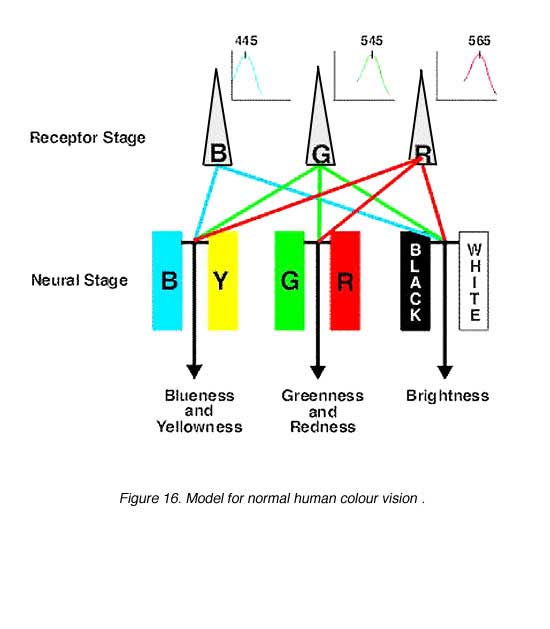
Stage Theory: This has led to the modern model of normal colour vision which incorporates both the trichromatic theory and the opponent colour theory into two stages (figure 16). The first stage can be considered as the receptor stage which consists of the three photopigments (blue, green and red cones). The second is the neural processing stage where the colour opponency occurs. The second stage is at a post-receptoral level, and occurs as early as the horizontal cell level.
 5. Colour Vision Deficiencies.
Colour vision deficiencies (CVD) can be congenital or acquired. Congenital CVD means that the CVD is present at birth and is inherited while acquired CVD occurs secondary to eye disease. Congenital CVD comprised of ~8 % of males and ~0.5% of females.
CVD are classified into three groups. These are monochromasy, dichromasy and anomalous trichromasy. People with normal colour vision are called trichromats. Monochromats are typically totally colour blind and may have one cone pathway in addition to the rod pathway. Dichromats have a cone photopigment missing, therefore, they only have two cone channels. Anomalous trichromats have all three cone photopigments, however, one cone photopigment is anomalous having a shifted peak sensitivity The types and prevalence of CVD is listed in Table 1.
Table 1 Prevalence of congenital colour deficiencies
| Types of colour vision deficiency | males | females |
| Overall | ~8% | ~0.5% |
| Anomalous trichromasy | ||
| protanomaly | 1% | 0.01% |
| deutanomaly | 5% | 0.4% |
| tritanomaly | rare | rare |
| Dichromasy | ||
| protanopia | 1% | 0.01% |
| deuteranopia | 1.5% | 0.01% |
| tritanopia* | 0.008% | 0.008% |
| Monochromasy | ||
| rod monochromasy | rare | rare |
| cone monochromasy | rare | rare |
| atypical monochromasy | very rare | very rare |
Modified after Cole (1972), Pease (1998) and estimates from Wright (1952)*
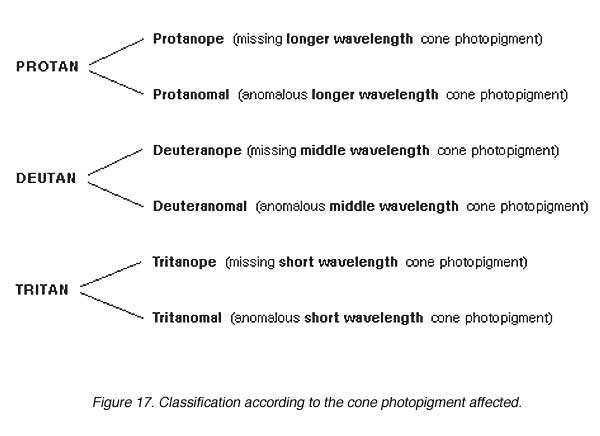
Dichromasy and anomalous trichromasy can be classified according to the affected cone photopigment. Three terms that are used also used to describe CVD are protan, deutan and tritan (from the Greek protos Ð first, deuteros Ð second and tritos Ð third; the order the colour vision deficiencies were described). A protan has the longer wavelength cone photopigment missing or anomalous, a deutan has the middle wavelength cone photopigment missing or anomalous and the tritan has the shorter wavelength cone photopigment missing or anomalous. (figure 17).
The pattern of inheritance for deutan (red-green) CVD is sex-linked recessive while tritan CVD has an autosomal dominant inheritance. The genetics of CVD is particularly important in the clinic as patients are often keen to understand why they are CVD and whether they will pass their CVD to their children. For some time it was thought that congenital inherited tritanopia did not exist because so few cases had been reported. Also, tritan-like colour vision deficiencies are associated with disease, making it essential to discriminate between acquired and congenital tritan defects. The existence of congenital inherited tritanopia was originally established by family studies (eg, Henry et al., 1964; Cole et al., 1966; Smith et al 1973) and subsequently confirmed by molecular genetics (Nathans et al., 1986a,b).
6. Using the CIE Diagram to Develop Diagnostic Colour Vision Test.
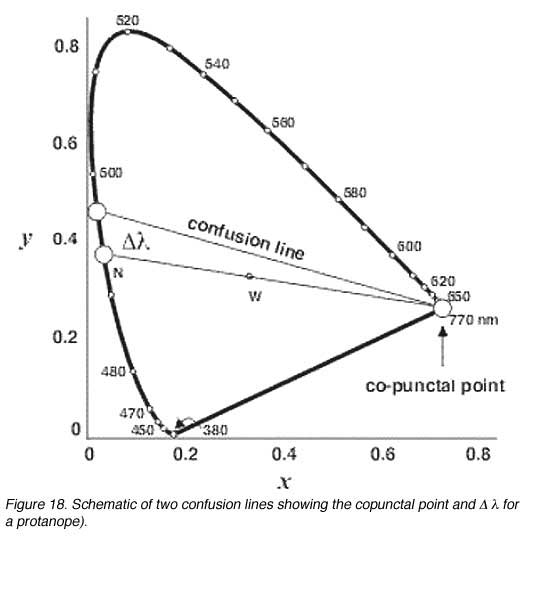
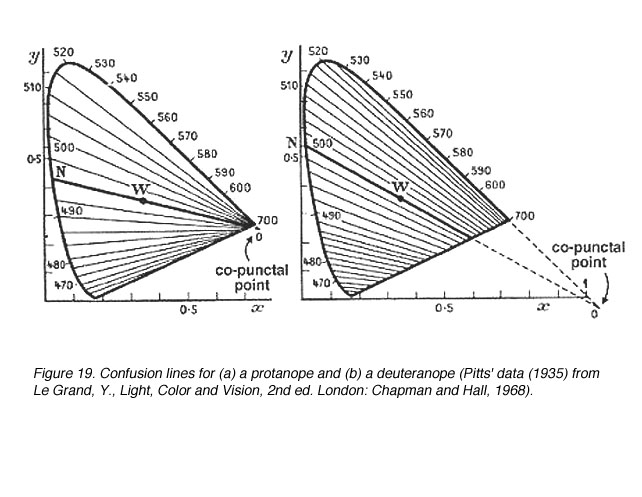
Discrimination of colour by dichromats is limited due to one photopigment being absent. Therefore, when it comes to colour matching, certain colours are confused with another. Confusion lines are lines joining points on the chromaticity diagram that appear the same in colour for dichromats. The number of confusion lines also provide information about the amount of change in wavelength (D l) before another colour is discriminated (when the next confusion line is met). All confusion lines converge to a point called the copuntal point (figure 18).
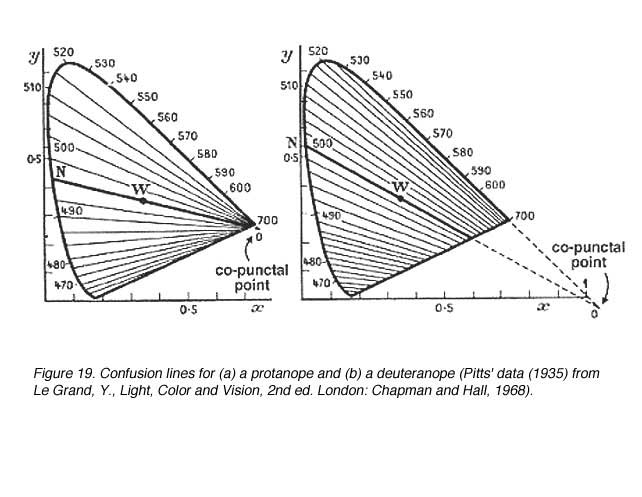
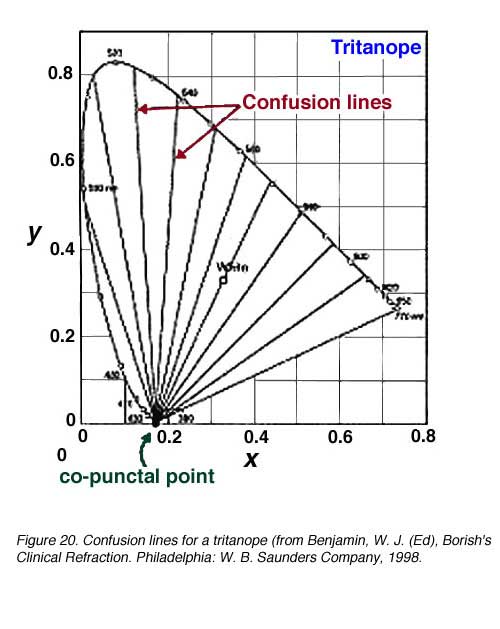
 In figure 19 show the confusion lines for a protanope and a deuteranope. There are 17 confusion lines for a protanope and 27 confusion lines for a deuteranope. Therefore, deuteranopes can discriminate more colours because smaller changes in wavelength (D l steps) can be discerned. Figure 20 shows the confusion lines for the tritanope.
 |  |
Colour vision tests
Confusion lines form the basis of many colour vision tests such as the Farnsworth Panel D-15 and Ishihara Pseudoisochromatic plates. Pseudoisochromatic plate tests are also commonly used in the clinic to screen for colour vision deficiency. Colours are carefully chosen based on the confusion lines. The most commonly used pseudoisochromatic plate in the clinic would be the Ishihara Isochromatic plates (for screening red-green colour vision deficiency) and the Tritan (F-2) plate.
Pseudoisochromatic plates are designed in four ways:
- Transformation plates: where a person with normal colour vision sees one figure and a CVD person sees another (figure 21a).
- Vanishing plates: where a person with normal colour vision see the figure while a CVD person will not (figure 21b).
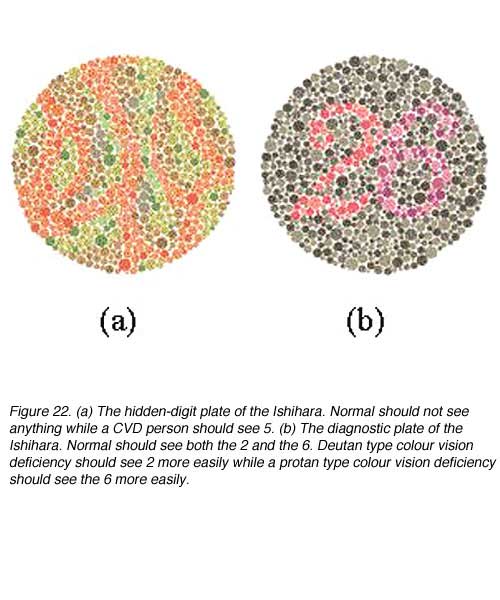
- Hidden-digit plates: where a person with normal colour vision does not see a figure while a CVD will see the figure (figure 22a).
- Diagnostic plates: designed to be seen by normal subjects with colour vision defectives seeing one number more easily than another (figure 22b).
 |  |
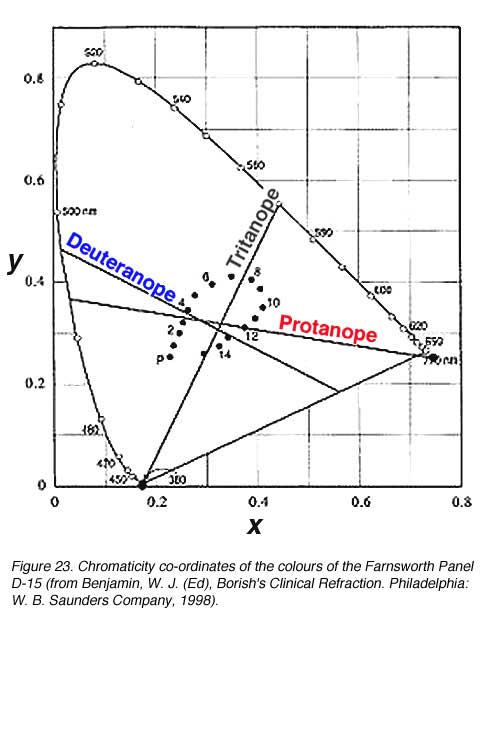
The Ishihara colour vision test is a screening test and the fail criterion for the Ishihara is typically four or more plates. Further colour vision testing will be required to confidently diagnose the type of colour vision defect. Another useful screening plate test is the Farnsworth F-2 plate (Pease, 1998). There are many colour vision tests available for screening and for diagnosis of which only a few will be discussed here. The colours of the Panel D-15 are also carefully chosen from the CIE diagram so they are all isoluminant (that is, have the same value) as seen in figure 23.
 Patients are asked to arrange 15 coloured caps in sequential order based on similarity from the pilot colour cap (figure 24).
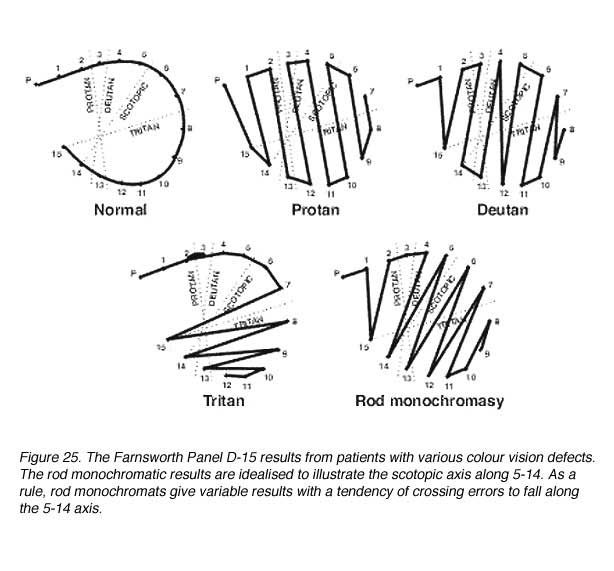
 The type of colour vision defect can be detected from their arrangement of the caps. These colour caps are arranged in a particular fashion due to the confusion of colours that lie on the confusion lines (figure 25). The criterion for failure in the Panel D-15 test is two or more major crossings (ie, greater than a two cap error). Deutan, protan and tritan will produce characteristic errors (crossings) according to their confusion lines. Rod monochromats are colour blind and their Vl peaks at about 507 nm. They arrange the D-15 caps according to the scotopic reflectance of the D-15 caps.
Other arrangement colour tests include the L’Anthony’s Desaturated Panel D-15, saturated H-16 and the Farnsworth 100-Hue Test. The desaturated panel D-15 is particularly useful in the early diagnosis of acquired diseases and mild congenital deficiencies. The sequence of test administration include screening for colour vision deficiencies with a pseudo-isochromatic plate test such as the Ishihara and F-2 plate. Failure of either of these tests implies proceeding to the panel D-15. A patient who fails the Panel D-15 is said to be a moderate to severe anomalous dichromat, or a dichromat. A patient who then fails the H-16 is a dichromat or very severe anomalous trichromat, whereas a moderate anomalous trichromat will pass the H-16. A subject who passes the D-15, can proceed to the desaturated D-15, that can pick up the mild anomalous trichomats. The very mild anomalous trichromats who may or may not fail pseudoisochromatic plates can be diagnosed with the Nagel anomaloscope.
The Farnsworth 100-Hue is another arrangement test (figure 26). Unlike the tests mentioned above where the colours are specifically chosen to lie close to the confusion lines, the Farnsworth100-Hue is a discrimination test.
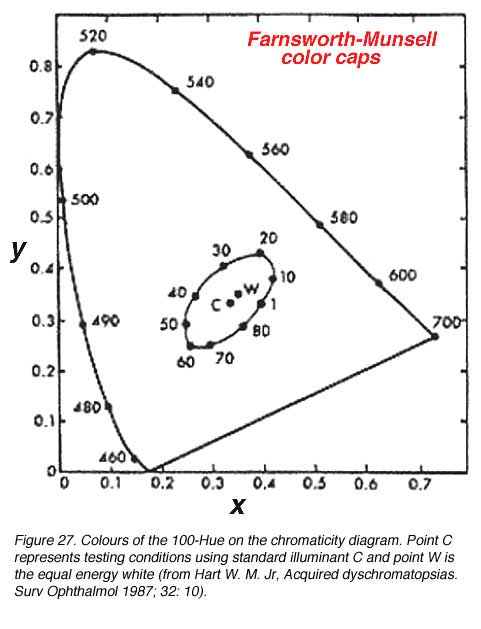
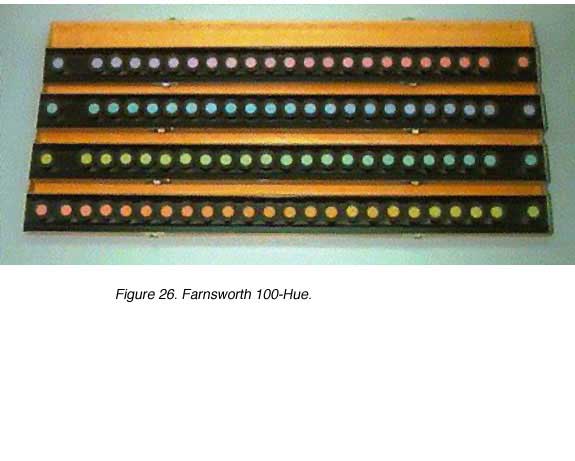 Figure 27 shows where the colours of the 100-Hue lie on the chromaticity diagram. The colours are chosen to have the same Munsell value and chroma. Originally there were 100 hues, but Farnsworth removed 15 to make the series more uniform. Performance on the Farnsworth 100-Hue is rated by calculating the total error score.
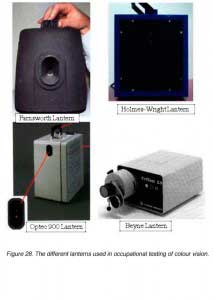
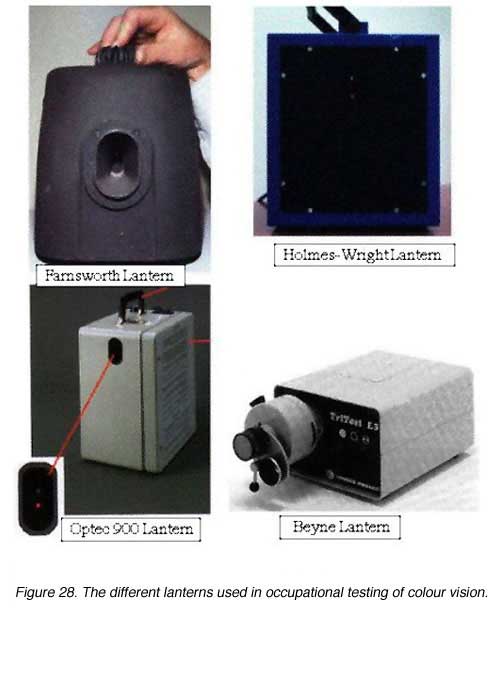
Lantern tests have been used since the19th century as a means of assessing colour vision especially for occupational reasons. Lantern tests simulate coloured signal lights. They usually present pairs of red, white and green lights because these are the signal colours used at sea and in air navigation, and the subject is required to name the colours. There are a great number of different lantern tests which vary quite widely in the level of difficulty they present. The level of difficulty depends on the size of the stimulus and its intensity (see Cole and Vingrys 1982 for a review). The lanterns in current use are the Farnsworth lantern, now superseded by the Optec 900, the Holmes Wright Type A and B lantern and the Beyne lantern (figure 28).
Lantern tests are usually failed by dichromats and anomalous trichromats whose defect is severe enough to cause them to fail the Farnsworth D15 test but the ability to recognise small coloured signal lights can vary quite widely among those with mild anomalous trichromasy. A pass at the D15 test or a small range at the anomaloscope does not necessarily mean that signal light colours can be recognised (Cole and Maddocks, 1998).
 References.
- Baylor DA, Nunn BS, Schnapf JL. The photocurrent, noise and spectral sensitivity of rods of the monkey Macaca fascicularis. J Physiol. 1984;357:575–607.[PubMed] [Free Full text in PMC]
- Benjamin WJ, editor. Borish’s clinical refraction. Philadelphia: W. B. Saunders Company; 1998.
- Bowmaker JK, Dartnall HJ. Visual pigments of rods and cones in human retina. J Physiol. 1980;298:501–511. [PubMed] [Free Full text in PMC]
- Cole BL, Henry GH, Nathan J. Phenotypical variations of tritanopia. Vision Res. 1966;6:301–313.
- Cole BL. The handicap of abnormal colour vision. Aust J Optom. 1972;55:304–310.
- Cole BL, Vingrys AJ. A survey and evaluation of lantern tests of color vision. Am J Optom Physiol Opt. 1982;59:346–374. [PubMed]
- Cole BL, Vingrys AJ. Who fails lantern tests? Doc Ophthalmol. 1983;55:157–173. [PubMed]
- Cole BL, Maddocks JD. Can clinical colour vision tests be used to predict the results of the Farnsworth lantern test? Vision Res. 1998;38:3483–3485. [PubMed]
- Davson H. The eye.Vol 2. London: Academic Press. 1962
- De Monasterio FM, Gouras P. Functional properties of ganglion cells of the rhesus monkey retina. J Physiol. 1975;251:167–95. [PubMed] [Free Full text in PMC]
- De Valois RL, Abramov I, Jacobs GH. Analysis of response patterns of LGN cells. J Opt Soc Am. 1966;56:966–977. [PubMed]
- Gouras P. Identification of cone mechanisms in monkey ganglion cells. J Physiol. 1968;199:533–547. [PubMed] [Free Full text in PMC]
- Graham CH. Color: data and theories (Chapter 15) and Discriminations that depend on wavelength (Chapter 12). In: Graham CH, editor. Vision and visual perception. New York: John Wiley and Sons, Inc.; 1965.
- Grassmann HC. Zur theorie der farbenmischung. Ann Phys. 1853;89:69–84.
- Hart WM. Acquired dyschromatopsias. Surv Ophthalmol. 1987;32:10–31. [PubMed]
- Henry GH, Cole BL, Nathan J. The inheritance of congenital tritanopia with the report of an extensive pedigree. Ann Hum Genet. 1964;27:219–231. [PubMed]
- Hering KEK. Zur Lehre vom Lichtsinne. Sitzungsberichte der kaiserlichen Akademie der Wissenschaften. Mathematisch–naturwissenschaftliche Classe, Wien, 3.Abtheilung. 1872;66:5–24.
- Hurvich LM, Jameson D. An opponent-process theory of color vision. Psychol Rev. 1957;64:384–404. [PubMed]
- Le Grand Y. Light color and vision. 2nd ed. London: Chapman and Hall 1968.
- Marks WB, Dobelle WH, MacNichol JR. Visual pigments of single primate cones. Science. 1964;143:1181–1183. [PubMed]
- Marriott FHC (1962) Colour Vision: Colour-Matches. Chapter 13. In: Davson, H. (ed), The Eye, vol 2. London, Academic Press.
- Moses RA, Hart WM. . Adler’s physiology of the eye. Clinical application. 8th ed. St. Louis: C. V. Mosby Company. 1987
- Nathans J, Piantanida TP, Eddy RL, Shows TB, Hogness DS. Molecular genetics of inherited variation in human color vision. Science. 1986;232:203–210.[PubMed]
- Nathans J, Thomas D, Hogness DS. Molecular genetics of human color vision: genes encoding blue, green, and red pigments. Science. 1986;232:193–202.[PubMed]
- Pease PL. (1998). Color vision (Chapter 9). In: Benjamin WJ, editor. Borish’s clinical refraction. Philadelphia: W. B. Saunders Company.
- Rushton WAH. A cone pigment in protanope. J Physiol. 1963;168:345–359. [PubMed]
- Rushton WAH. Densitometry of pigments in rods and cones of normal and color defective subjects. Invest Ophthalmol. 1966;5:233–241. [PubMed]
- Smith DP, Cole BL, Isaacs A. Congenital tritanopia without neuroretinal disease. Invest Ophthal. 1973;12:608–617. [PubMed]
- Smith VC, Pokorny J. Spectral sensitivity of the foveal cone photopigments between 400 and 500 nm. Vision Res. 1975;15:161–171. [PubMed]
- Svaetichin G. Spectral response curves from single cones. Acta Physiol Scand Suppl. 1956;39:17–46. [PubMed]
- von Helmholtz H. . Handbuch der physiologischen Optik.[English translation in MacAdam DL.(1970). Sources of color science. Cambridge (MA): MIT Press; 1970] Hamburg: L. Voss. 1866
- Wright WD. The characteristics of tritanopia. J Opt Soc Am. 1952;42:509–520. [PubMed]
- Young T. On the theory of light and colours. Philos Trans R Soc Lond. 1802;92:12–48.
- Zrenner E, Gouras P. Characteristics of the blue sensitive cone mechanism in primate retinal ganglion cells. Vision Res. 1981;21:1605–1609. [PubMed]
The autor

Michael Kalloniatis was born in Athens Greece in 1958. He received his optometry degree and Master’s degree from the University of Melbourne. His PhD was awarded from the University of Houston, College of Optometry, for studies investigating colour vision processing in the monkey visual system. Post-doctoral training continued at the University of Texas in Houston with Dr Robert Marc. It was during this period that he developed a keen interest in retinal neurochemistry, but he also maintains an active research laboratory in visual psychophysics focussing on colour vision and visual adaptation. He was a faculty member of the Department of Optometry and Vision Sciences at the University of Melbourne for some years, moved to New Zealandas the Robert G. Leitl Professor of Optometry, Department of Optometry and Vision Science, University of Auckland. Since 2008 Mike has returned to Syney, Australia as a Faculty member at the University of New South Wale, and is now Director, Centre for Eye Health, an initiative of Guide Dogs NSW/ACT and the University of New South Wales (UNSW). E-mail to m.kalloniatis@unsw.edu.au