
1. Overview
Ganglion cells are the final output neurons of the vertebrate retina. Ganglion cells collect information about the visual world from bipolar cells and amacrine cells (retinal interneurons). This information is in the form of chemical messages sensed by receptors on the ganglion cell membrane. Transmembrane receptors, in turn, transform the chemical messages into intracellular electrical signals. These are integrated within ganglion-cell dendrites and cell body, and ‘digitized’, probably in the initial segment of the ganglion-cell axon, into nerve spikes. Nerve spikes are a time-coded digital form of electrical signalling used to transmit nervous system information over long distances, in this case through the optic nerve and into brain visual centers.
Ganglion cells are also the most complex information processing systems in the vertebrate retina. It is a general experimental truth that an organism as a whole cannot behaviorally respond to visual stimuli that are not also detectable by individual ganglion cells. Different cells become selectively tuned to detect surprisingly subtle ‘features’ of the visual scene, including color, size, and direction and speed of motion. These are called ‘trigger features’. Even so signals detected by ganglion cells may not have a unique interpretation. Equivalent signals might result from an object changing brightness, changing shape, or moving. It is up to the brain to determine the most likely interpretation of detected events and, in the context of events detected by other ganglion cells, take appropriate action.
Ganglion cell axons terminate in brain visual centers, principally the lateral geniculate nucleus and the superior colliculus. Ganglion cell axons are directed to specific visual centers depending of the visual ‘trigger features’ they encode. The optic nerve collects all the axons of the ganglion cells. In man this optic nerve bundle contains more than a million axons.
2. History of Electrical Recordings
In 1967 Ragnar Granit and H. Keffer Hartline shared the Nobel prize in physiology and medicine for the first electrical recordings of light responses from individual ganglion cells of the vertebrate retina. In this, both laureates acknowledged the earlier seminal influence of Edgar D. Adrian, winner of the 1932 Nobel prize in physiology and medicine. Adrian pioneered the measurement of impulse discharges from individual peripheral nerve axons and was principally responsible for the discovery that nerve fibers transmit signals in the form of a temporal sequence of ‘all or none’ impulses. Granit also noted the influence of the anatomist Santiago Ramon y Cajal, winner of the 1906 Nobel prize, in illustrating a complex retinal circuitry worthy of physiological investigation. Hartline pushed experimental technology of the 1930’s to its limits in obtaining extracellular recordings of individual ganglion cells. There were no solid state electronics. Special purpose, ‘direct coupled’ vacuum tube amplifiers were designed. There were no oscilloscopes or computers for display and storage of signals. String galvanometers were used; a pencil of light played from a tiny mirror, minutely vibrating in a magnetic field, onto moving photographic film to document electrical events. There were no microelectrodes; ganglion cell axon bundles were teased off the retinal surface with dissecting tools and lifted onto a course cotton wick electrode, such as earlier used for massed potential recordings. Ultimately this technique proved too difficult to pursue and left no legacy. It remained for Granit (1947) to introduce microelectrodes for such recordings, which greatly facilitated the ease of data collection. Granit also made the first ganglion cell recordings from a mammalian retina, the cat retina. This retina, as pursued by his students and others, has been a staple of visual electrophysiology. Yet the experimental designs and approaches provided by Hartline continue to be used. So many of his findings, such as the multiplicity of ganglion cell response types, have proved accurate, such that the succeeding field of ganglion cell electrophysiology sometimes appears almost as a footnote to his work.
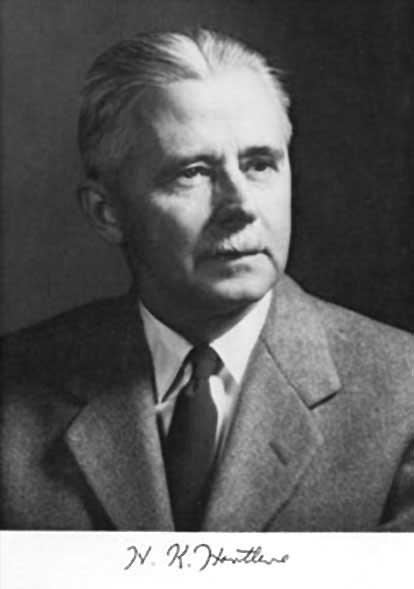 Fig. 1.Haldan Keffer Hartline, 1967 Nobel Laureate.. | 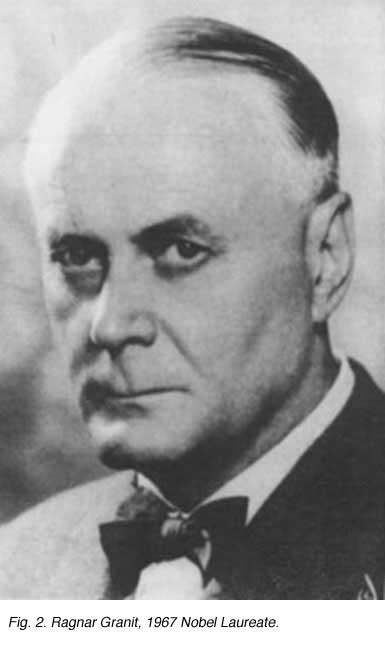 Fig. 2. Ragnar Granit, 1967 Nobel Laureate. Fig. 2. Ragnar Granit, 1967 Nobel Laureate. |
3. ON and OFF Responses
Hartline’s electrical recordings of single optic nerve fiber responses revealed ‘discharges of impulses’, or ‘action potentials’ in response to light stimulation. The discharge patterns were, however, diverse (Hartline, 1938). Three unique patterns of light response were described (Fig.3).
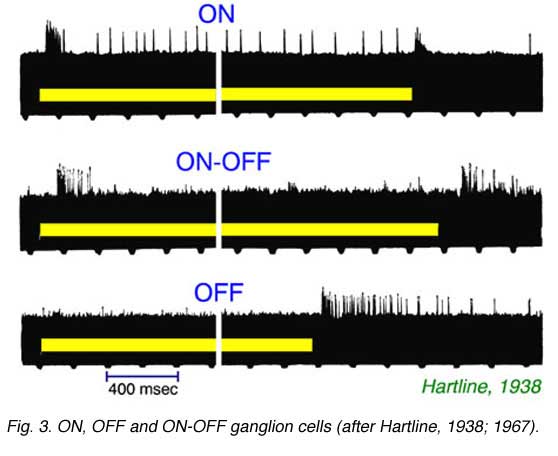 |  |
‘ON’ type fibers responded with a transient burst to light onset, and a sustained elevated discharge rate throughout the photic stimulation (Fig. 3). ‘ON-OFF’ fibers responded with discharge bursts at the onset and cessation of light stimuli, but were otherwise quiet. ‘OFF’ fibers were quiet until the stimulus light was turned off, whereupon they responded with a sustained burst of impulses. The situation was far different from fibers in the optic nerve of the invertebrate Limulus polyphemus, which Hartline also studied. There, all fibers responded with ‘ON’ type discharges. The result implied that a relatively high degree of visual processing occurred within the vertebrate retina, and that visual information was filtered by retinal circuitry into a number of sub-categories. The exact number of such categories is still difficult to define exactly, but now would easily number a dozen (Cleland and Levick, 1974b, DeVries and Baylor, 1997). Because of the diverse categories of responses found in retinal ganglion cells, these cells are sometimes thought of as ‘feature detectors’ (Lettvin et al, 1959).
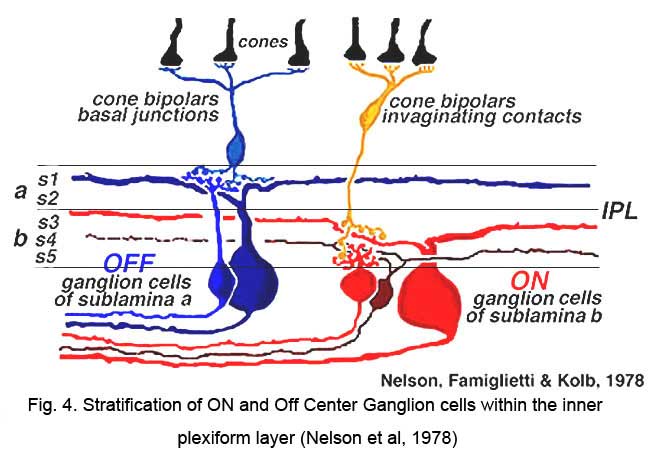
‘ON’ and ‘OFF’ type signal detection remains as the most significant subdivision among visual features extracted by ganglion cells. Combined morphological and physiological studies of individual ON and OFF type ganglion cells revealed different inner plexiform layer stratification patterns (Nelson et al 1978, Peichl and Wässle, 1981; Amthor et al, 1989a) and suggested a basis in retinal circuitry for these types (Fig. 4). The dendrites of OFF type ganglion cells branch in the inner plexiform layer zone close to the amacrine cell bodies. Here they come in synaptic contact with the axon terminals of OFF type bipolar cells. The dendrites of ON type ganglion cells branch in the inner plexiform layer zone close to the ganglion cell bodies. Here they make synaptic contact with the axon terminals of ON type bipolar cells (Nelson et al. 1978). Dendritic trees of ON-OFF cells typically arborize in both zones of the inner plexiform layer, presenting a ‘bistratified’ appearance (Amthor et al, 1989b).
4. Receptive field
Hartline introduced the ‘nearly definable’ concept of ‘receptive field’ to describe the spatial properties of retinal ganglion cells. He used ‘spot mapping’ to define such fields, a technique still widely employed. Cells were found to respond to relatively dim spots when the stimulus was positioned in the ‘center’ of the receptive field but brighter stimuli were required as the spots were moved away from this region. An example of the ‘spot mapping’ technique, taken from Kuffler (1953) shows the reduction in response vigor as stimulus spots are displaced from the center (Fig. 5). Hartline concluded that ganglion cell receptive fields were fixed in space and immobile, typically did not extend beyond 1 mm in diameter, and were graded in sensitivity over this region. Receptive fields were much larger than expected of individual photoreceptors, suggesting signal processing and integration through retinal circuitry.

Evidently circuitry was the source of a spatial weighting function, shaped so that sensitivity diminished radially with distance from the ‘receptive field center’. Hartline also noted other features suggestive of hidden complexity in this simple concept. Response wave forms tended to become more transient and less sustained as spots were displaced (Fig. 5). Subtle movements, on the order of a few µm, much smaller than the receptive field itself, could evoke vigorous discharges, a kind of ganglion cell ‘hyperacuity effect’ (see also Shapley and Victor, 1986).
5. Centers and Surrounds
Though Hartline went on to study lateral inhibition of receptive fields in Limulus retina, and his laboratory made other valuable contributions to neurobiology and vision, But discovery of lateral inhibitory interactions in vertebrate ganglion cells and the concept of ‘antagonistic surround’ is generally credited to Stephen Kuffler.
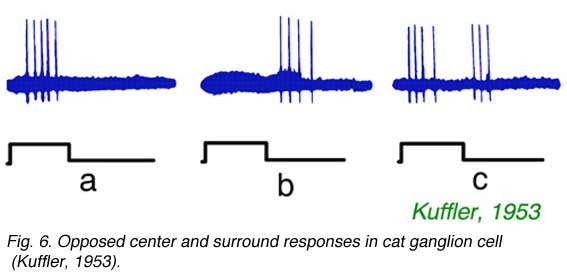
As noted by Hartline, not only strength of response, but also a change in form of response occurs as stimuli are moved across ganglion cell receptive fields. Kuffler (1953) noted a particularly abrupt change in form, from onset excitation for stimulation in the center of the field to offset excitation for stimulation in the receptive field periphery. An example is illustrated in Fig. 6. In Fig. 6a, a spot, centered near the electrode tip, evokes a burst of impulses at stimulus onset. In Fig. 6b the spot is displaced by 0.5 mm, where it evokes no impulses at onset, but a burst of impulses at offset. In Fig. 6c an intermediate spot position is found where both actions are evoked by the stimulus. The example (Fig. 6) shows properties of a classic ON-center, receptive field, with OFF surround. Conversely OFF-center cells, which are excited at stimulus offset by central stimulation, have regions in peripheral receptive field where ON excitation is evoked. This is the classic center-surround receptive field organization of ganglion cells. Such organization was further examined with intracellular recording techniques. These techniques revealed not only the ganglion cell impulses, but also the slow changes in ganglion cell membrane potential which modulate the impulse rate.
CLICK to see an animation of the center and surround receptive field organization of a beta ganglion cell (Quicktime movie)
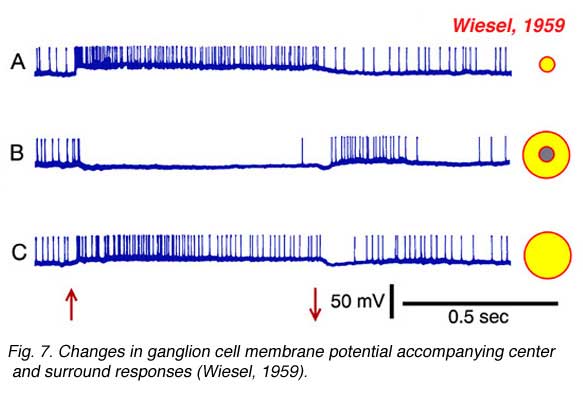
Torstein Wiesel, 1981 winner of the Nobel prize in physiology and medicine, provides an example of such an intracellular recording in Fig. 7, which allows further features of the surround response to be seen. In Fig. 7a, a small spot of light depolarizes the membrane of the cell and evokes a vigorous burst of impulses. This is an ON-center cell. In Fig. 7b the stimulus is an annulus, a ring of light designed to stimulate the receptive field surround, but not the center. Impulses are silenced during stimulus presentation, but a burst appears at annulus offset. This is a classic surround pattern. A hyperpolarization of the membrane occurs while the annulus is ON and impulses are silenced. This is a feature of the response hidden from extracellular recording methods. The surround stimulus actively inhibits the cell by hyperpolarizing its membrane. Finally, the response to the large spot stimulus (Fig. 7c) should not be neglected. The large spot, like the small spot (Fig. 7a) evokes a membrane depolarization and sustained burst of impulses. But the depolarization is smaller, and the burst less vigorous. The net impact of the center-surround receptive-field structure is that ganglion cells ‘prefer’ small spots to large spots! Size selectivity is a unique and telltale characteristic of ganglion cell physiology. To summarize, ganglion cell center-surround interaction is a multifaceted phenomenon:
Features of ganglion cell center-surround interactions:
1) Change from sustained to transient center response as stimuli are displaced from center.
2) Excitatory responses evoked to opposite stimulus phase with surround stimulation.
3) Active inhibition of the center response with surround stimulation.
4) A maximal response can be evoked only with an optimally sized spot.
The question arises whether the four phenomena listed above represent a single mechanism or several. Evidence tends to suggest the latter, since there are many cases where some of these phenomena are present but not others. The most ubiquitous and characteristic feature is 4) however, spatial tuning. Even cells which do not fit into the ON or OFF center categories, such as the true ON-OFF center cells, as described by Hartline (Fig. 3b) still exhibit spatial tuning.
6. Contrast Sensitivity Functions and the Difference of Gaussians Receptive Field Model
The characteristic ‘spatial tuning’ of ganglion cell receptive fields is reflected in peaked contrast sensitivity functions (Fig. 8). Each vertebrate ganglion cell is ‘tuned’ (responds best) for objects of a different size. Among the population of ganglion cells, a wide range of sizes is covered, perhaps corresponding to the wide range of object sizes in the visual image. This tuning reflects in part the variable dendritic span in ganglion cells (as elaborated below). Dendritic span is one of the factors allowing ganglion cells to collect visual signals over a broad reach of visual space. Receptive field centers and dendritic fields can be similar in size (Yang and Masland, 1992) (Fig. 9). But dendritic field span in itself does not provide for a decline in sensitivity as stimulus sizes become large. Surrounds are required. Tuning can be modeled as a result of center-surround interaction. In the OFF-center cell of Fig. 9 ON-excitatory surround responses are evoked by slit stimuli placed near the edge of the dendritic field (Nelson et al., 1993).
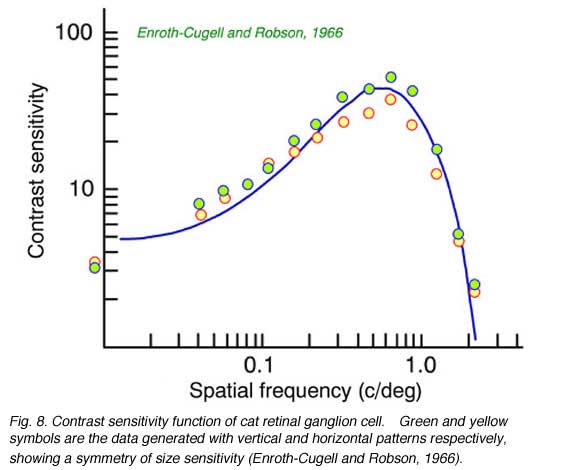 |  |
Contrast sensitivity functions are a receptive field characterization generated, not using spots or slits of light, but broad-field stimuli consisting of spatial sine waves. These appear as patterns of alternating, fuzzy-edged, light and dark bars covering all of visual space. ‘Contrast’ is the difference in brightness between the light and dark phases of the pattern. In this receptive field characterization, contrast is reduced until the ganglion cell just barely responds to the introduction of such a stimulus into a featureless field. This is the threshold. The process is then repeated for patterns with different bar widths, or ‘spatial frequencies’ (the reciprocal of the number of bright and dark bar-pairs per unit distance). The sensitivities (the reciprocals of contrast thresholds) are plotted as a function of spatial frequency. The net result is a curve (Fig. 8) which demonstrates that in ganglion cells there is an optimal spatial frequency of stimulation. Patterns of this frequency can be observed with the highest sensitivity and lowest contrast. In Fig. 8 this frequency is about 0.6 cycles per degree, which scales to a bright-dark bar pair every 350 µM on the retinal surface, or a bright bar width of half this distance (175 µM).
Contrast sensitivity is one measure of size selectivity in ganglion cells. Another measure is ‘hyperacuity’. This is the ability to detect movements within the ganglion cell receptive field. Cat ganglion cells can detect image displacements as small as 1′ of arc (about 4 µm on the retinal surface or a movement of about 3 cm at 100 m distance). These displacements are much smaller than one might expect based on receptive field center sizes (which are typically several hundred µm in diameter on the retinal surface) or contrast sensitivity functions (Shapley and Victor, 1986). Both contrast sensitivity measures and hyperacuity measures have the appeal that they may be applied equally as well to the sensitivity of a whole organism as to a single cell. Comparisons of organism performance to ganglion cell performance generally leads to the conclusion that organisms cannot detect visual stimuli that are not detected at least equally well by ganglion cells.
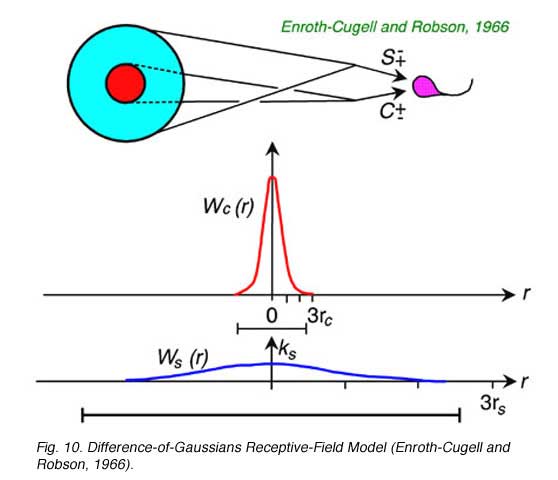
Peaked contrast sensitivity functions can be successfully modeled as a linear subtraction of two concentric, opposed receptive-field mechanisms (Fig. 10). In a well-studied version of this model both the center (Wc(r)) and the surround (Ws(r)) are given Gaussian sensitivity profiles, with greatest sensitivity in the center of the receptive field, and a smooth, steep decay of sensitivity away from the center (Rodieck, 1965). The center mechanism predominates for centrally located stimuli, because it is stronger at this location, but the surround mechanism prevails for peripheral stimulation because the surround radius (rs) is greater than the center radius (rc). These radii affect the rates at which sensitivity declines as stimuli are moved away from the center. This model is often referred to as the DOG (difference of Gaussians) model. The curved line fitting the data in Fig. 8 was generated by a DOG model.
7. X and Y receptive fields
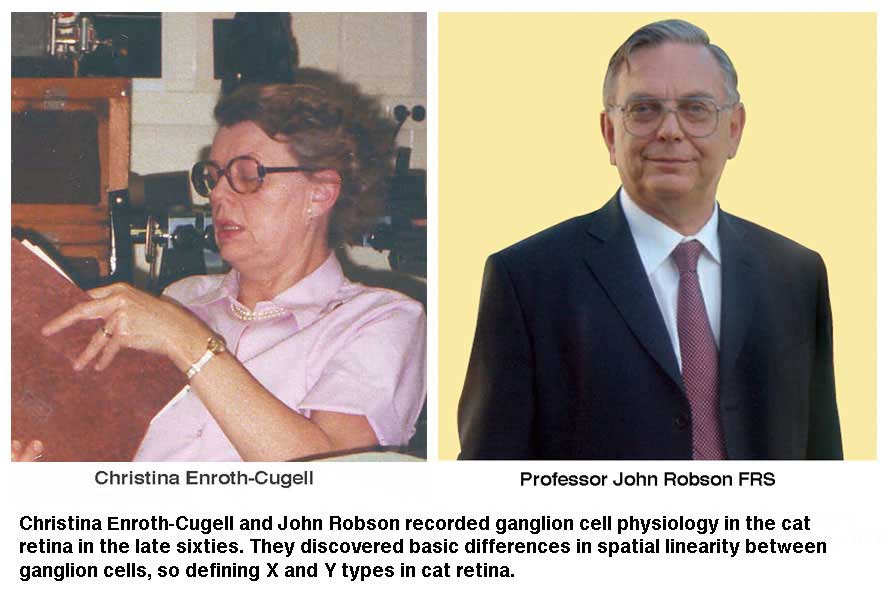
One of the assumptions of the difference of Gaussians model (Enroth-Cugell and Robson, 1966) is that ganglion cells linearly add signals from both center and surround mechanisms for all points in space. This suggested that ganglion cells could be tested for spatial linearity. Enroth-Cugell and Robson (Fig. 11a) discovered that some cells (X-cells) pass the test, while others (Y-cells) do not, despite the fact that all receptive field data are well represented by the DOG model.

In Fig. 11b impulse firing rate is shown for different positions (or spatial phase) of the sine wave stimulus with respect to the receptive field center. To change the spatial phase, the pattern is shifted right and left by incremental amounts. For the X cell (Fig. 9A), when the pattern is positioned so that the transition from light to dark passes directly through the center of the field, a ‘null response’ is produced. Introduction of the stimulus produces no effect on firing rate. The tendency of the bright bars to excite the cell is exactly compensated by the tendencies of the dark bars to reduce the firing rate. For the Y cell (Fig. 9B) no such stimulus position can be found. There is always a residual response, in this case the ‘null phase’ results in transient increases in firing at both introduction and removal of the stimulus. The test is a particularly severe one for linearity. Not only is perfect spatial summation required, but the form of response to light increments must be exactly the opposite to the form of response to a light decrement in order for effects to exactly cancel. Y-cells may have linear spatial summation, but evidently increment and decrement wave forms are not sufficiently symmetric for signals to cancel. This failure of linearity in Y cells is thought to be due to inputs from non-linear subunits (Shapley and Victor, 1979).
X and Y cells are differentiated in other ways as well. X cells are numerous and have rather narrow receptive fields, and in cat retina are utilized for highest acuity vision. These are morphologically the ‘beta’ cells of cat retina. Y-cells are rather sparsely distributed and have wide receptive fields. These are morphologically the ‘alpha’ cells of the cat, and most likely serve a visual alerting function. They are sometimes named according to the shape of the response wave form to steps of light. Y cells are called ‘brisk transient’ cells, and X cells are called ‘brisk sustained’ cells (Cleland and Levick, 1974a). Y cells are also distinguished from X cells by larger axon diameters and quicker conduction times from retina to the thalamic visual centers of the brain. These sets of cells initiate two separate and parallel pathways for transfer of visual information to brain visual centers. (Cleland et al, 1971). Morphological features and the distribution of X/beta, Y/alpha ganglion cells are discussed below.
8. Directionally Selective Ganglion Cells
Computing the direction of motion for a moving object or scene is the most complex information processing task performed by vertebrate retinas. Directionally selective retinal ganglion cells respond to stimuli moving in a preferred direction and are inhibited by stimuli moving in the opposite or null direction. The preferred direction is independent of the nature of the object, which can be either bright or dark, a simple object such as a small spot, or a complex object, such as a drifting grating (Barlow and Hill, 1963). Because of center-surround inhibition, however, like other ganglion cells, directionally selective cells respond best to small spots. In addition to a preferred direction of movement these cells have preferred speeds of movement, some prefer slow movements, while others prefer rapid movements. They most commonly exhibit true ON-OFF receptive field centers when mapped with stationary spots, though not all cells with ON-OFF centers are directionally selective. Less frequently encountered types are ON-center when mapped with stationary spots (Barlow et al, 1964) or OFF-center (Jensen and deVoe, 1983). This type of response is encountered in many vertebrate retinas including birds (Maturana and Frenc, 1963; Holden, 1977), reptiles (Jensen and deVoe, 1983; Kittila and Granda, 1994; Ammermuller et al., 1995), some mammals (Barlow and Hill, 1963; Michael, 1968), fish (Cronley-Dillon, 1964; Jacobson and Gaze, 1964) and amphibians (Werblin, 1970), but is rather rare in cat (Cleland and Levick, 1974b) or primate retinas (de Monesterio and Gouras, 1975)
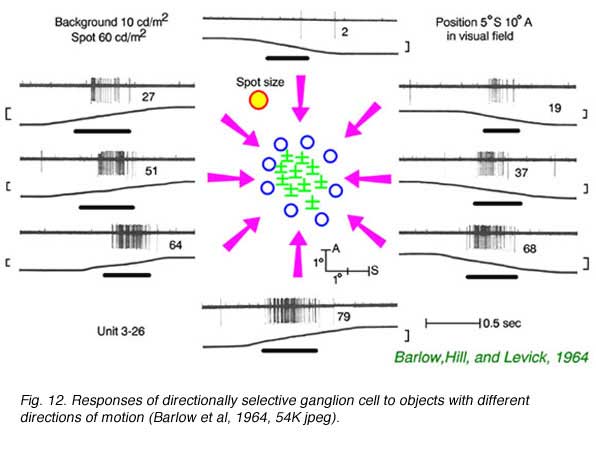
In Fig. 12 small spots of light are moved into the field of an ON-OFF type rabbit directionally selective ganglion cell from differentpoints of the compass. When the spot is moved up from the bottom, a vigorous spike discharge occurs. When the spot is moved down from the top, no response occurs.
9. Modeling Directional Selectivity
The amazing feat of signal extraction found in directional selectivity, performed by a remarkably few retinal neurons, has sparked sustained interest in modeling this system. Such attempts have generally met with failure (He and Masland, 1997), but here are some of the givens and some of the approaches. 1) It is generally believed that retinal interneurons are not themselves directionally selective (Werblin, 1970), except perhaps in turtle retina (Criswell,1987; Ammermuller et al., 1995; Borg-Graham,1997). 2) Models must yield the same preferred direction for both dark and bright spots. Originally it was thought that the contrast invariance of directionally selective cells was due to the common ON-OFF type physiology (Dowling, 1970) and interactions between signals of the ON and OFF pathways. The discovery of both ON-type and OFF-type directionally selective cells with contrast invariance suggests this is not the case. The persistence of directionally selective responses under pharmacological blockade of the ON component also suggests that cooperation of both ON and OFF bipolar pathways may not be required. In ON-OFF cells both pathways yield the same preferred directions, however (Kittila and Massey, 1995). 3) There is evidence of preferred direction facilitation (Grzywacz and Amthor, 1993) as well as null direction inhibition. 4) There is little evidence that directionally selective ganglion cells themselves exhibit morphological polarization (Jensen and deVoe, 1983; Amthor et al, 1989b; Yang and Masland, 1992; 1994).
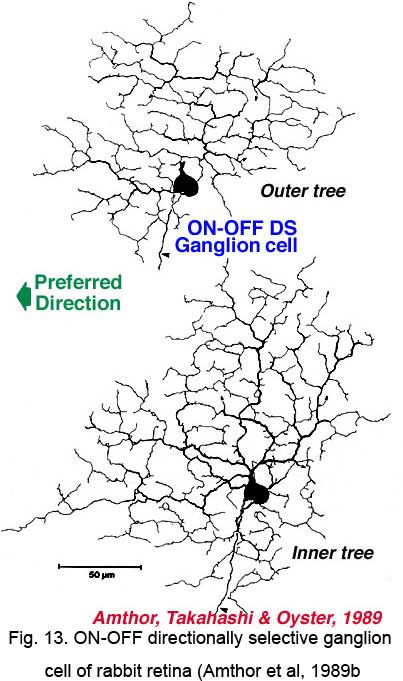 | 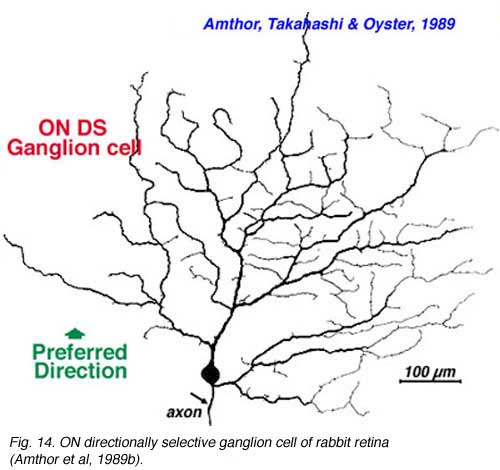 |
Directionally selective ganglion cells, stained after microelectrode recordings have a distinctive dendritic morphology with many apparently closed, or nearly closed, loops, giving the appearance of anastimosing dendrites (Fig. 13, 14). ON-OFF directionally selective ganglion cells are bistratified in the inner plexiform layer (Fig. 13) while ON-type directionally selective cells are monostratified, close to ganglion cell bodies (Fig. 14). None of these morphological features hints at the orientation of the null/preferred axis, however.
Some form of morphological polarization of presynaptic interneurons is a common feature of models of directionally selectivity. 1) Intrinsic neurons with axons. Originally the axon bearing horizontal cells of mammals were suggested as providing the directional arrow in the retina (Michael, 1968). Since ON and OFF pathways have not yet diverged at the horizontal cell level of signal processing, contrast invariance would be explained. However bipolar cells were not found directionally selective (Werblin, 1970). Association amacrine cells with intraretinal axons have been been found in pigeons (Mariani, 1982). With appropriate connectivity these might be the substrate of directional selectivity. Unfortunately such cells do not appear to be common to most species. 2) Functional polarization of presynaptic amacrine cell dendrites. Starburst amacrine cells are cholinergic and excitatory (see link) and appear to release acetyl choline primarily at dendritic tips. An excess innervation by such amacrine cells on one side of the directionally selective cell might result in preferred direction excitation. Ablation of these cells with lasers, or pharmacological blockade of acetylcholine have failed to abolish directional selectivity, though (He and Masland, 1997).
10. Pharmacology of Directional Selectivity
Some pharmacological agents abolish, or partially abolish directional selectivity. The most classic of these is picrotoxin, a convulsant, and blocker of receptors for the inhibitory neurotransmitter gamma-aminobutyric acid (GABA). Both GABAAand GABAC type receptors, the latter very common in retina, are blocked by picrotoxin.
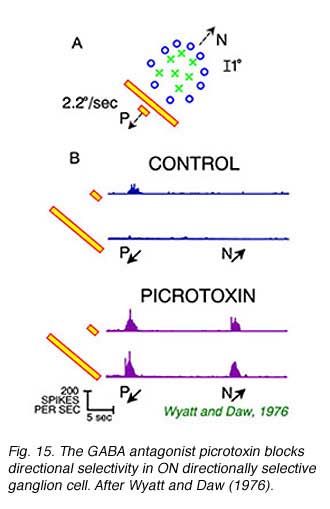 | 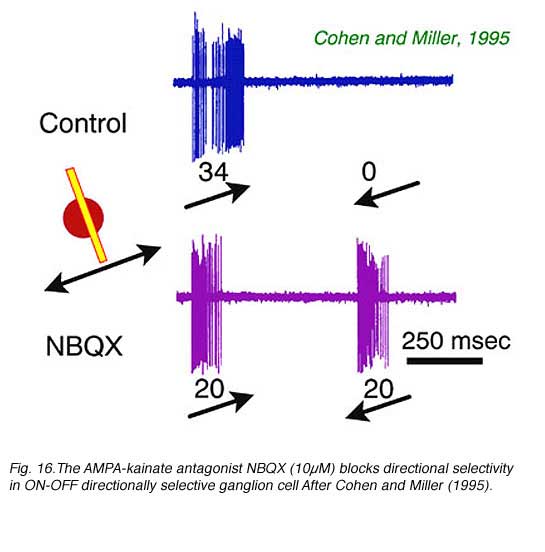 |
Fig 15A illustrates the static receptive field properties of an ON directionally selective cell in rabbit retina. This cell responds to spots moving towards the lower left (P), but not the upper right (N, Fig 15B). No responses are seen to bars of light, regardless of the direction of motion. This indicates a particularly strong surround antagonism suppressing responses to large stimuli. Picrotoxin abolishes both directional selectivity and size specificity. In these experiments (Wyatt and Daw, 1976) strychnine, another convulsant and blocker of the inhibitory neurotransmitter glycine,did not have these effects. This suggested that GABA was selectively important in neural circuitry underlying the generation of directionally selective responses. The GABAA selective antagonist SR95531 blocks directional responses suggesting that this particular subtype of GABA receptor is critical to the process (Kittila and Masey, 1995).
The neurotransmitter acetyl choline is a potent excitatory agent for directionally selective ganglion cells (Ariel and Daw, 1982). It is released by presynaptic cholinergic ‘starburst’ amacrine cells and provides excitation at both onset and offset of the stimulus. Blockade of cholinergic input (Cohen and Miller, 1995; Grzywacz et al, 1997), or ablation of cholinergic amacrine cells, reduces but does not abolish directional selectivity (He and Masland, 1997). The metabotropic glutamate receptor agonist APB blocks the ON component of all responses in ON-OFF type directionally selective cells (Cohen and Miller, 1995; Kittila and Massey, 1995). However, the OFF component of directional responses remains. NMDA (N-methyl-D-aspartate) receptor agonists do not block directionally selective responses, and by implication directionally selective ganglion cells contain excitatory NMDA response components which are non-directional (Cohen and Miller, 1995). Interestingly, the AMPA-kainate receptor antagonist NBQX potently blocks directional selectivity in both ON-OFF and ON type cells leaving vigorous responses to movement in all directions (Fig. 16). Thus a non-NMDA glutamate receptor may be selectively involved in the directionally selective mechanism, possibly as an excitatory (bipolar) input to a GABAergic interneuron (Cohen and Miller, 1995).
11. Color and Spectral Responses
Ganglion cells respond to colored stimuli in one of two ways: color opponent responses and luminance responses. The patterns are similar to those of horizontal cells, which occur in chromatic and luminance types. Color opponent ganglion cells are found principally in vertebrates which behaviorally can discriminate color. Goldfish are an animal model with color vision and have provided much information on the way in which vertebrate retinas process color. In this animal it was first realized that individual cones express only one each of three genomically available cone photopigment types (colloquially red, green, or blue cones, technically long, L, mid, M, or short, S, wavelength types). This supported at least part of Thomas Young’s 19th century ‘trichromatic theory of color vision. Neural retina does not preserve the purity of thisspectral trilogy, however. Signals are both added and subtracted to form
luminance and color opponent channels, respectively. Color opponency was a color vision theory of the 19th century physiologist Ewald Herring (1875). Retina operationally combines both Young and Herring ideas in processing spectral information.
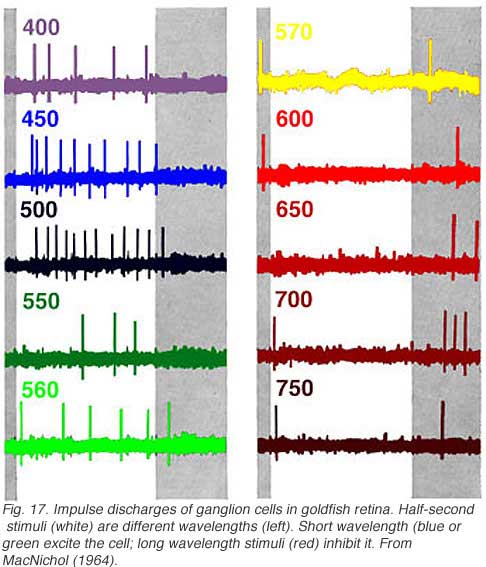
In Fig. 17 white light is broken into spectral colors with a monochrometer and flashed on the retinal surface while recording ganglion cell discharges. Short wavelength lights (400-560 nm, blue or green) excite the cell evoking impulse discharges. Long wavelength stimuli (570-700 nm, red) inhibit discharges during presentation, but evoke discharges at offset. This is a classic color opponent pattern of the RG (red/green) type (Wagner et al, 1960). There is also a symmetrical type excited by red stimuli and inhibited by green.
In cells with input pathways arising from more than one spectral class of cone, the relative strength of different cone inputs can be modified by colored backgrounds (Wagner et al, 1960). This is called ‘selective chromatic adaptation.’ In the cell of Fig. 17, red backgrounds reduce the strength of OFF inhibitory responses, allowing green ON excitatory responses to be seen at long wavelengths. Conversely green backgrounds reduce the strength of ON responses and allow red OFF responses to be seen at short wavelengths. Modification of spectral properties by colored backgrounds is often used to evaluate cone inputs, even in the absence of color opponent signals.
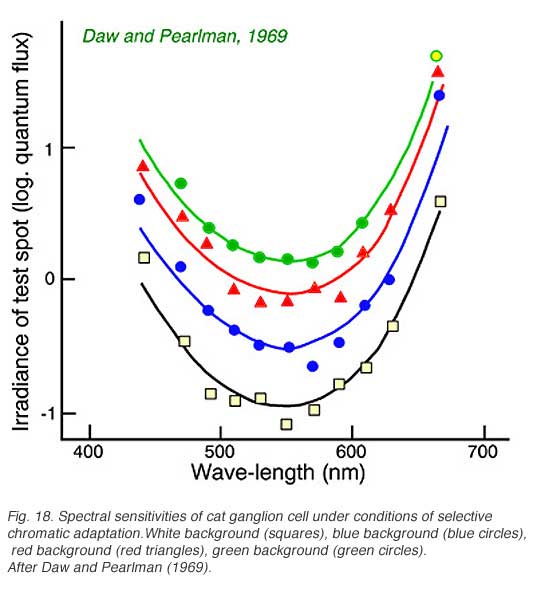 | 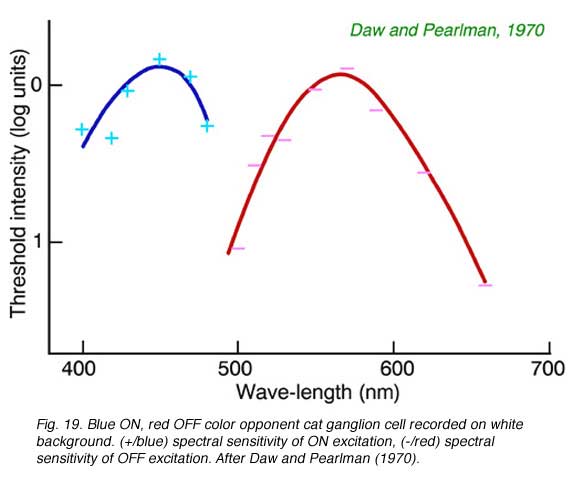 |
Cats, like many other large mammals aside from primates, are often thought to be color blind. Present evidence suggests that cats can distinguish blue from colors of longer wavelength (Daw and Pearlman, 1970), but that their color acuity is much worse than primates (Loop et al, 1979). Ganglion cells in cat retina are primarily of the luminosity type. Fig. 18 provides an example of this type of cell. Spectral curves always peak a 556 nm, characteristic of the cat’s red cones, regardless of attempts to shift the sensitivity towards longer or shorter wavelengths with selective chromatic adaptation. Very rarely color opponent cells are seen in cat. In Fig. 19 is an example of a cell excited by blue stimuli and inhibited by red. In cat retina such cells may account for only 1% of the ganglion cell population, all with blue ON excitation and red OFF inhibition (Daw and Pearlman, 1970; Cleland and Levick, 1974).
12. Color and Receptive Fields
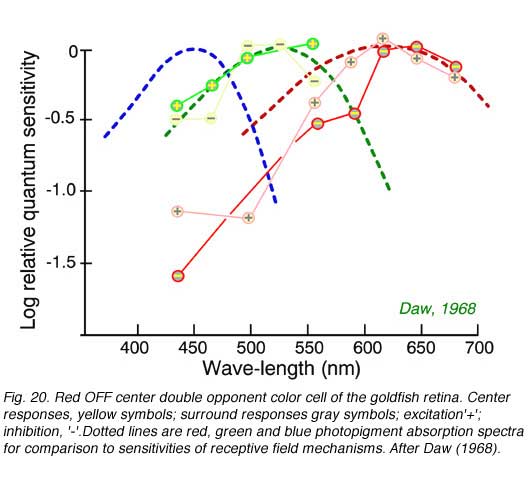
Color opponent ganglion cells can have centers and surrounds each with separate color opponent properties. A common type in goldfish retina is the double opponent ganglion cell. In this type each color mechanism in the receptive field center is opposed by a mechanism of the same color type but opposite sense in the surround. Spectral properties of a goldfish ganglion cell with a red OFF center, red ON surround in combination with a green ON center, green OFF surround appears in Fig. 20. This type of cell is thought to excel at ‘simultaneous color contrast’: the ability to detect color changes at borders.
 | 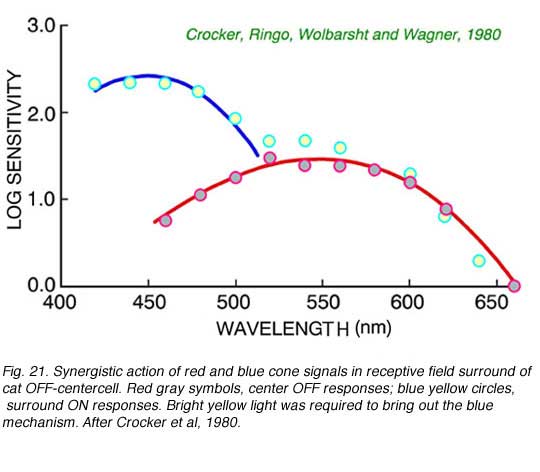 |
Color opponency is not the only way in which cone signals are processed in the retina. In Fig. 21 is an example of synergistic addition of blue and red cone signals in the surround mechanism of a cat OFF-center ganglion cell. It is apparent then, that ganglion cells may combine cone signals in a myriad of ways. In the twilight-hunting cat, signal detection may be more important that color discrimination. Adding signals from different cone mechanisms may increase signal amplitudes across the spectrum. Multiple cone types may thus serve at least two roles: discrimination of color, and increased spectral coverage.
13. Tonic and phasic ganglion cells of primate retina
Primate retinal ganglion cells occur in two broad categories: ‘tonic’ and ‘phasic’ as described by Gouras (1968). Tonic cells respond to light stimuli in a steady maintained manner. Receptive field centers are extremely small, about 15 µm on the retinal surface (~4′ of arc, about 10 cm at 100 m distance). Tonic cells are often called ‘midgets’ because they probably represent recordings of midget ganglion cells described by Polyak (1941), see below). They occur with a density distribution across the retina comparable to anatomically midget cells (Gouras, 1968). The tiny receptive field centers match well the anatomical sizes of these tiny cells. The optic nerve conduction velocities of tonic fibers are slow (~2 m/s, Gouras, 1969). As a group these cells are also often referred to as the ‘parvocellular pathway’ or ‘P’ cells. This is because the tonic fibers terminate in the parvocellular layer of the lateral geniculate nucleus of the thalamus.
‘Phasic’ responses originate with morphologically larger ganglion cell types with fast optic nerve fiber conduction velocities (~4 m/s, Gouras, 1969). Microelectrodes staining of such cells shows that they are ‘parasol’ types (Dacey and Lee, 1994). ON types branch low in the inner plexiform layer (sublamina b), while OFF types branch high in the inner plexiform layer (sublamina a) following the classic branching pattern for ON and OFF center cells (Nelson et al, 1978; Dacey and Lee, 1994). Phasic cells are often referred to as the ‘magnocellular’ or ‘M-cell’ pathway because their fibers terminate in the magnocellular layer of the lateral geniculate nucleus of the thalamus. Near the fovea receptive fields of phasic cells are 2-3 times larger than those of tonic cells and may be 10 times larger in peripheral retina.
Tonic cells of the parvocellular pathway respond best to stimuli with high contrast and fine grain, while phasic cells to stimuli with very weak contrast covering larger areas (Kaplan and Shapley, 1986).
14. Color properties of primate ganglion cells
Tonic cells occur in three spectral types: red-center cells, green-center, and blue-center cells. Stimuli consisting of small spots evoke spectral responses consistent with the action of only a single spectral type of cone in each case. Surround responses are also spectrally selective, and are generated only from spectral types of cone not found in the center responses (De Monasterio and Gouras, 1975). Tonic cells are spectrally opponent types, but the opponent signals are distributed in different regions of space.
Phasic cells combine red and green cone signals synergistically in both center and opponent surround mechanisms of the receptive field. These cells are luminosity types and are not generally color opponent, although in some cases an imbalance of the strength of spectral mechanisms in center and surround generates some opponent characteristics (De Monasterio and Gouras, 1975).
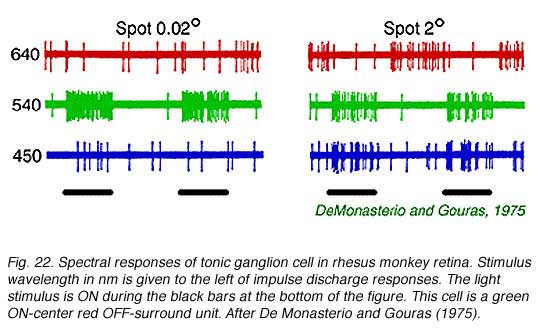 |  |
A classic tonic ganglion cell with green ON-center and red OFF-surround responses appears in Fig. 22. Small green spots (0.02o,540 nm) excite the cell evoking a maintained discharge. Large red spots (640 nm, 2o) inhibit impulse firing, but excitation occurs when the red stimulus is turned OFF. This is a chromatically opponent receptive field surround mechanism. In Fig. 23 are spectral sensitivities of three different tonic cells for small spots. Spectral sensitivities are not altered by selective chromatic adaptation (De Monasterio and Gouras, 1975) indicating that each center mechanism behaves as if it were driven by a single spectral class of cone. At the top of the figure is a blue sensitive tonic cell. The 650 Fresnel peak on the light frequency axis corresponds to about 450 nm, the peak of blue sensitive cones. Similarly, the middle panel (Fig. 23) illustrates a green center tonic cell, and the lower panel, a red center tonic cell. It is important to realize that tonic cells come in OFF- as well as ON-center varieties. Thus there are at least 6 different center mechanisms for this concentric color opponent class of cell. Blue OFF-center types appear to be particularly rare, however (De Monasterio and Gouras, 1975). Some surround mechanisms in tonic cells combine more than one cone mechanism. When the different color properties of surrounds are considered there are a total of 12 spectral categories for this class. Reid and Shapley (1992), however, find only one spectral class of cone in tonic cell surrounds.
 | 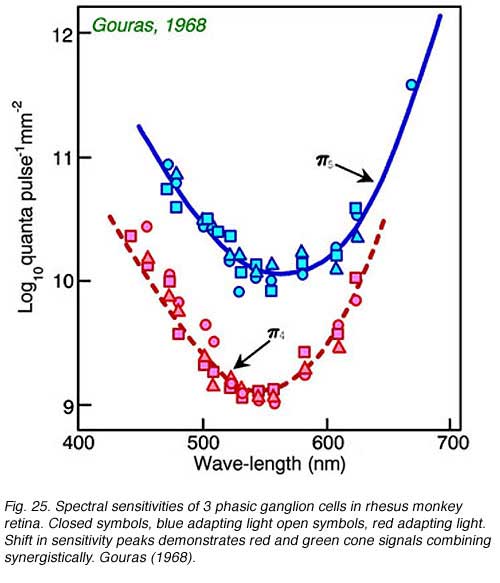 |
Impulse discharges of a phasic ganglion cell (Fig. 24) exhibit an initial transient burst followed by a sustained discharge for small spots, and only a transient ON burst for large spots, as delayed antagonistic surround responses, induced by the large stimulus, inhibit the sustained response component. Large red spots evoke a particularly brisk OFF discharge from the receptive field surround. The cell is spectrally a luminosity type, with excitatory center responses to all wavelengths of stimulation. Both red and green cone signals sum synergistically to produce the center responses of primate phasic ganglion cells (Fig. 25). Red background lights will selectively desensitize the red cone signal components, revealing the green cone component of the center response, likewise blue background lights selectively desensitize the green cone signal component revealing red cone contributions to the center response.
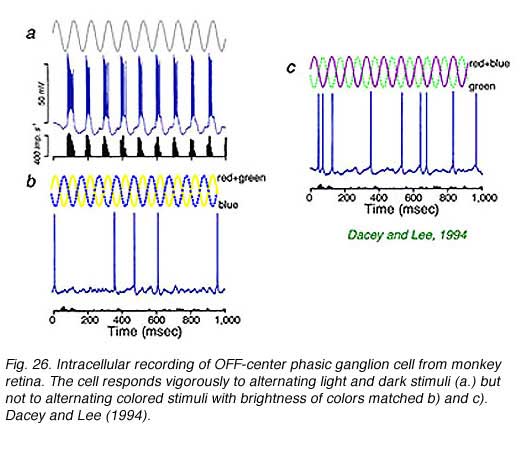 |  |
Intracellular recordings from phasic ganglion cells in isolated monkey retina (Fig. 26) confirm that these responses originate in ‘parasol’ type ganglion cells (Fig. 27). The phasic, parasol response is chromatically a luminosity type. Vigorous responses are evoked by alternating bright and dark periods (Fig. 26a) but not by alternating blue and yellow colors (Fig. 26b), or magenta and green colors (Fig. 26c) balanced for brightness. Phasic cells sense luminance changes but not color changes (Dacey and Lee, 1994).
There are also color opponent ganglion cells in primate retina with color opponent centers but no surround (class 2: color opponent, non-concentric, De Monasterio and Gouras, 1975). These occur in both blue-yellow and red-green opponent types. The receptive fields are rather large, similar to phasic cells. Opposed spectral mechanisms fully overlap within this large receptive field center (De Monasterio and Gouras, 1975). No antagonistic surround mechanisms is found. Dacey and Lee (1994) have recorded and stained a candidate for one of these types, a blue-yellow opponent cell. Morphologically it is a small bistratified ganglion cell.
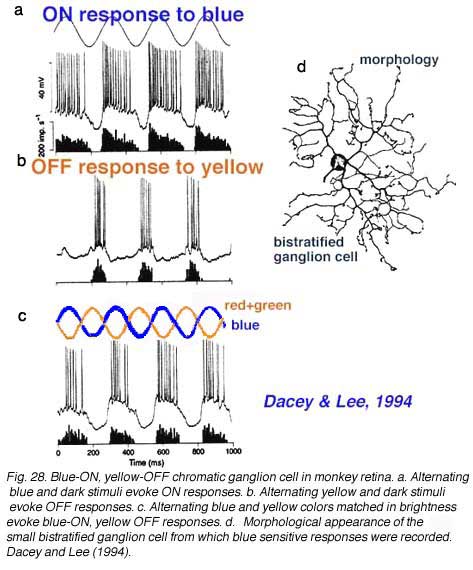
Unlike the phasic cell (Fig. 26) this blue-excited cell is able to respond to color changes, being excited by a change from yellow to blue stimuli of equal luminance (Fig. 28c). As a bistratified type it is clearly not a midget ganglion cell. Dacey and Lee plausibly argue that the cell receives OFF type red and green bipolar cell input onto its outer, OFF-layer dendritic tree, and ON-type blue bipolar cell input onto its inner, ON-layer dendritic tree. Dacey and Lee also describe a small, peripheral monostratified ganglion cell responding to red-green color changes, but not to the magenta-green color changes designed to excite blue sensitive ganglion cells. As yet foveal and parafoveal midget cells have not been marked by microelectrode staining techniques.
15. Rod signals in retinal ganglion cells
In addition to information about color, ganglion cells also transmit to the brain a monochromatic, non color containing signal from rods. Rods detect visual stimuli at very low light levels, including visual threshold. Their true sensitivity is rarely tested in a typical urban environment, but imagine a moonless rural night without street lights. Shapes and forms are fuzzy, colorless, and slowly perceived. This is rod vision. Such visual environments are often termed ‘scotopic’, in contrast to brighter ‘photopic’ environments where shape color and movement are readily seen. In photopic environments cones are active. Amazingly, individual ganglion cells transmit both sorts of information, a sort of multiplexing of signals with very different characteristics, though it is only with a ‘mesopic’ visual environment, with intermediate levels of ambient illumination, that both signals may be simultaneously present.
Rod and cone signals are found mixed in the major X and Y type ganglion cells (beta and alpha morphological types) in cat retina. (Enroth-Cugell et al, 1977), and such signals are always found to be of the same polarity as the center mechanism for cone signals. Rod and cone signals are clearly mixed in the phasic type ganglion cells of the primate magnocellular pathway (Wiesel and Hubel, 1966; Gouras, 1967). Whether tonic cells of the parvocellular pathway contain significant rod input remains controversial. Recent studies suggest such input is either weak, or absent (Lee et al, 1997) and may be absent entirely in blue center cells. The M-cell/magnocellular pathway appears likely to be the principal conduit for transferring visual information to the primate brain under conditions of dim illumination (Purpura et al, 1988). This point, however remains controversial (Merigan and Maunsell, 1993). In goldfish retina, only ganglion cells with red cone dominated center mechanisms contain rod signals (Raynauld, 1972). However no such selective cone association has been reported in primate (Wiesel and Hubel, 1966).
16. Rod signals are delayed
Rod signals develop more slowly than cone signals. Reaction times driving automobiles or playing sports out of doors is slower at night. This is because rod signals are characteristically slow and it is this photoreceptor system that is active at night or with dim illumination.
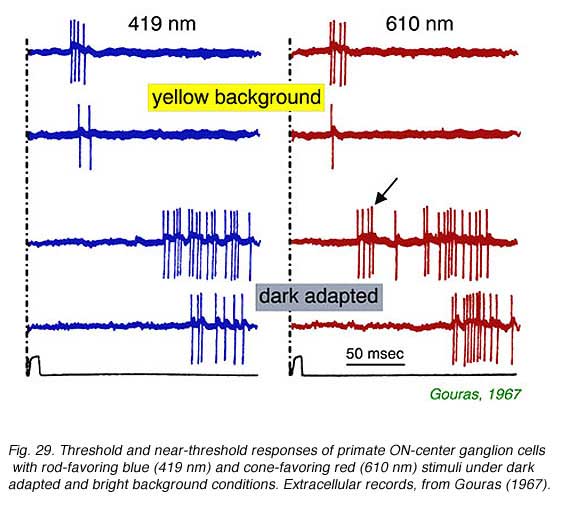 | 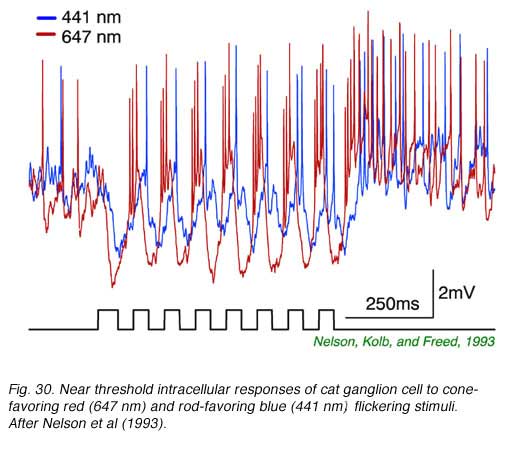 |
In Fig. 29, extracellular spikes from a primate ON-center retinal ganglion cell can be seen composed of two distinct clusters with different delays. With yellow backgrounds only short latency spikes are generated in response to a brief flash, regardless of wavelength or stimulus brightness. These are cone signals. Under dark adapted conditions and threshold stimulation, only long latency spikes occur. These are rod signals. Under dark adaptation and with somewhat brighter red stimuli, which begin to stimulate cones, a mixed response can be seen composed of both short latency cone components (arrow) and long latency rod components. In Fig. 30 rod and cone responses are seen in intracellular recordings of a cat OFF-center ganglion cell. Responses to flickering red (647 nm) stimuli arise mainly from red cones, while those from blue (441 nm) stimuli arise only from rods. Superposition of responses allows easy comparison of the timing of rod and cone signals with each flicker cycle. Rod ON hyperpolarizations evoked by the blue stimulus are distinctly delayed as compared to cone ON hyperpolarizations evoked by the red stimulus. The different delay is also apparent with the excitatory impulses evoked at the offset phase of each cycle.
 |
In a series of flicker responses evoked by different brightness of blue-light stimuli there is a characteristic shortening of phase delay with brighter stimuli. This reflects a shift from rod to cone activation in the ganglion cell signal. In Fig. 31 bright stimulus, cone dominated flicker appears in the left column of flicker responses, whereas dim stimulus rod-dominated flicker appears in the right column. The change in delay of ON-inhibition in this OFF alpha ganglion cell is readily apparent in comparison of the two columns. In fact, on the right, rod flicker response is so slow that the excitatory OFF response of the preceding flicker cycle appears in the very middle of the current ON stimulation cycle. Response contradicts stimulus, an example of how perception might be at variance with reality. A superimposed horizontal cell response behaves similarly in this brightness series, though overall it responds a little more slowly than the ganglion cell. Flicker cycles from an AII amacrine cell for dim stimuli are also shown. Many AII amacrines lack significant cone system signals, so that only very slow rod flicker can be observed. The rod responses of this AII cell are delayed 65-70 msec compared to bright light cone responses seen in ganglion cells or horizontal cells.
There is often a minimum amplitude in such flicker versus stimulus intensity series. This occurs because at brightness levels where rod and cone signals are both present, they are far enough out of phase with each other to mutually cancel. An example is seen in the 4.33 horizontal cell trace (Fig. 31). Flicker amplitudes for both dimmer and brighter stimuli are actually larger. The OFF-alpha ganglion cell appears also to have minimal, if not absent flicker, near this stimulus brightness. This counterintuitive effect can be subjectively perceived. Certain flicker stimuli can be seen if they are bright or dim, but not if of intermediate intensity (MacLeod, 1972).
Rod system delays occur in specialized retinal circuitry devoted to rods. The retina has developed a set of neurons and synapses especially tuned for processing visual signals under dim lighting conditions. These may include specialized synapses between rods and bipolar cells, as well as specialized sets of rod amacrine cells. These cells are tuned to the longer integration times of rods.
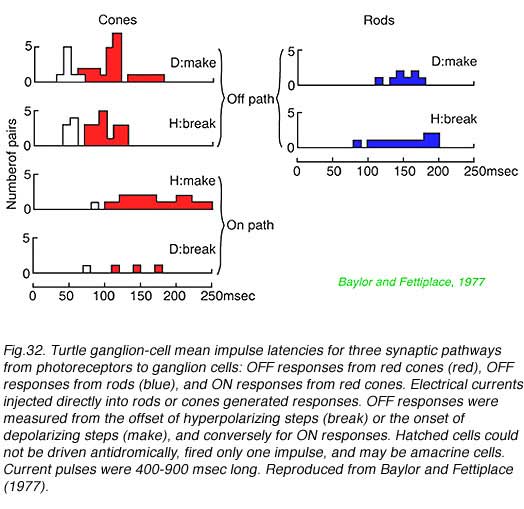
In Fig. 32 turtle ganglion cell impulses are evoked by electric current injection directly into rods and cones themselves. The delay to onset of the first impulse discharge in underlying ganglion cells is measured. This technique separates circuitry delays from delays in photoreceptor transductive machinery. OFF discharge latency (the time between cessation of hyperpolarizing current injection into a photoreceptor and the first ganglion cell impulse) was found to be about 100 msec when electrically stimulating red cones, but a longer (150 msec) when stimulating rods. Interestingly ON-discharges evoked by red cone stimulation (time from hyperpolarizing current onset to first spike) were also slow (170 msec), suggesting a slower pathway for ON cone information as well, possibly through a metabotropic glutamate pathway in such cone bipolar cells.
17. Detection of light quanta by retinal ganglion cells
Retinal ganglion cells have no true threshold for detection of dim stimuli (Barlow et al, 1971). When many responses are averaged, signals can be seen for light stimuli as dim as desired, and this includes stimuli so dim that only a few physical quanta of light are delivered to the surface of the eye at the cornea. Of course in total darkness retinal ganglion cells still exhibit a maintained but variable spontaneous firing rate and it is against this background noise that quantal responses must be detected.
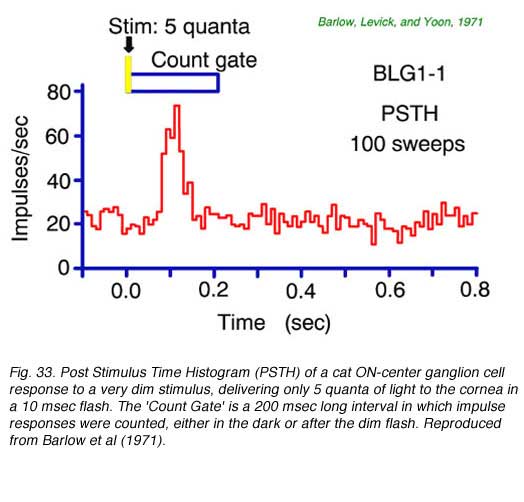
A post stimulus time histogram (PHST) averages the number of nerve spikes fired over time for many repetitions of a stimulus. It is a useful tool for detecting small signals. This is seen in Fig. 33 for a brief, dim stimulus which delivers on average only 5 quanta to the cornea each flash. Owing to optical losses, perhaps only 1 of these quanta is effectively absorbed in a rod and transduced into neural activity. Even so, on average, a substantial burst in mean firing rate occurs. Through analysis of data such as these Barlow et al. (1971) concluded that a single quantum absorption resulted in the firing of 2-3 extra ganglion cell nerve impulses. Cross correlations in firing patterns of adjacent cells under conditions of dim illumination agree with this estimate, and suggest the time course of increased firing probability for a single quantum absorption may last about 50 msec or more and that several adjacent ganglion cells detect the event (Mastronarde, 1983b).
Because of fluctuations in spontaneous background firing, single quantal events might not be readily detected in a single cell. However 3-4 quantal absorptions within the cell’s receptive field would be easily noticed in the discharge pattern.
18. Receptive field alterations with rod vision
In retinal ganglion cells, separate rod and cone pathways converge. One might expect then, during dark adaptation, as input signals to ganglion cells shift from cone-related to rod-related pathways, that receptive field properties of ganglion cells might change. The changes are, in fact, rather subtle and require careful probing with physiological stimuli and pharmacological tools. The size of receptive field center mechanisms frequently increases. Receptive field surround responses are often less vigorous. The pharmacology of light responses changes. All these effects result from changes in the dominant retinal circuitry pattern driving ganglion cells as the retina adjusts to dim lighting conditions.
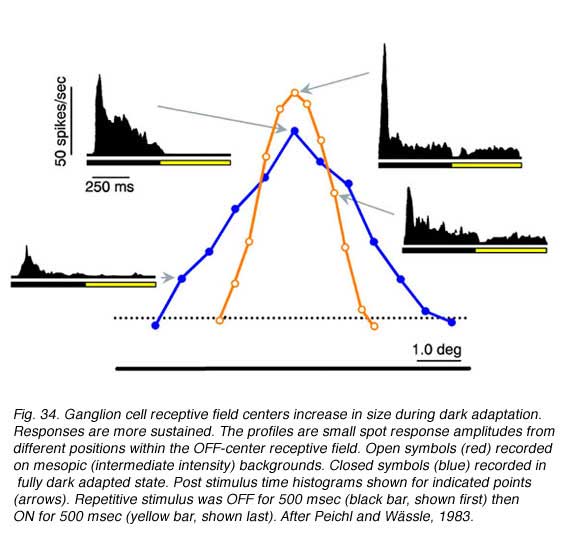
Changes in cat OFF type ganglion cell center size during light and dark adaptation appear in Fig. 34, where response discharge rates for small spot probes are mapped across the receptive field center. Under conditions of moderate light adaptation (mesopic, red) a narrowly peaked profile is observed signifying a localized receptive field center. With dark adaptation, the profile spreads out (scotopic, blue) as the center becomes larger and more diffuse. Along with changes in center size, there is a change in response waveform. Under mesopic conditions OFF excitation is brisk, transient and of short latency. Under scotopic conditions a more protracted, longer latency response occurs (similar to delays described above). In rabbit retina (DeVries and Baylor, 1997) dark adapted ganglion cell center mechanisms shrunk as much as 30% during light adaptation (mean, 12%).
Surround strength diminishes during dark adaptation. In Fig. 35 responses of an OFF-center rabbit retinal ganglion cell are followed through a prolonged period in the dark. After a brief (10 min) interval, a large spot stimulus evokes a weak ON discharge from the surround mechanism and a strong OFF discharge from the center mechanism. An annular stimulus, more selective for the surround mechanism, evokes a strong ON discharge from the surround and a relatively weak OFF discharge from the center (red). Following an extensive 30 min period of dark adaptation, the ON surround discharges disappear from responses evoked by either stimulus (blue).
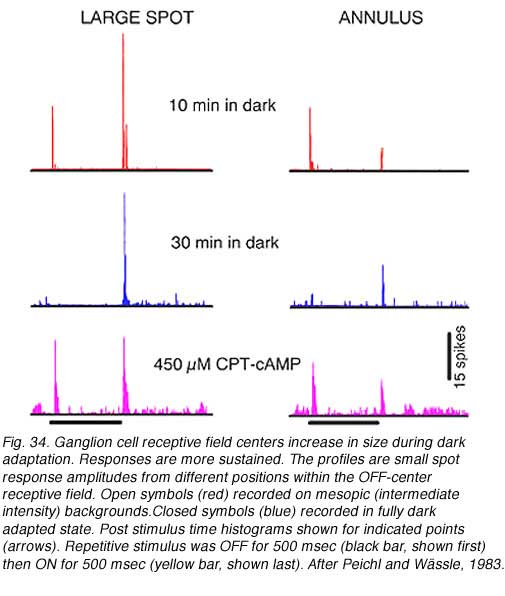
Loss of surround response can be reversed by pharmacological intervention (Fig. 35). Introduction of a cyclic AMP analogue (CPT-cAMP) into the perfusion media of this dark adapted ganglion cell restores surround responses (magenta). In further experiments (Jensen, 1991) strychnine, an antagonist of the inhibitory neurotransmitter glycine, was also found to restore surround responses to dark adapted ganglion cells. It appears thatsurround responses are actively inhibited in dark adapted retina by activation of glycinergic circuitry, probably from rod dominated amacrine cells. This glycinergic amacrine release appears modulated by the intracellular messenger cAMP.
A shift in the pharmacological sensitivities of ganglion cell center mechanisms also occurs during dark adaptation, particularly for OFF-center cells in cat retina. These responses become sensitive to agents active at metabotropic glutamate receptors, normally associated with ON type bipolar cells, and to agents selective for receptors to the inhibitory neurotransmitter glycine. Such sensitivities are not seen in the light adapted state.
 | 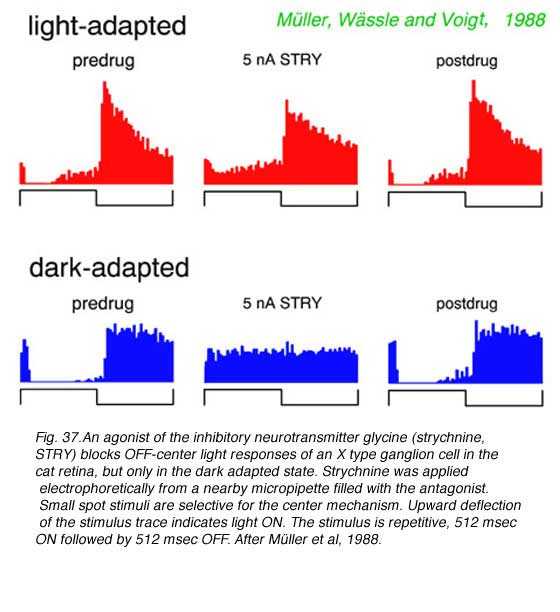 |
OFF discharges of a cat Y type ganglion cell appear unaffected by the metabotropic glutamate agonist APB in the light adapted state (Fig.36), an expected result as cone signals (and perhaps mesopic rod signals) are transferred to such cells primarily through OFF cone bipolar cells. These utilize ionotropic glutamate receptors (kainate or AMPA) in synaptic transmission, which are unaffected by APB. APB does effectively block ON inhibition in the dark-adapted state. Rod bipolars are ON type bipolars sensitive to APB. So this result likely means that ON type rod bipolar cells are the primary signal pathway for transferring visual signals from rods to these OFF-center ganglion cells during dark adaptation. Rod bipolars do not contact OFF-center ganglion cells directly, but through inhibitory amacrine cells, such as the glycinergic AII amacrine cell. In agreement with this circuit for dark-adapted signalling, strychnine blocks ON inhibition in an OFF-center X type ganglion cell (Fig. 37) but only in the dark adapted state. Light responses of ON-center cells are effectively blocked by APB in both light and dark adapted states.
APB may not effectively block rod signals in all ganglion cell types however. DeVries and Baylor (1995) showed In rabbit retina, that rod responses in ‘brisk’ ganglion cells were eliminated by APB, but rod responses of ‘directionally selective’ or ‘sluggish’ ganglion cell types were not. Rod signals that could not be blocked in these ganglion cells may use a pathway through rod-cone photoreceptor gap junctions into the APB-resistant OFF cone bipolar pathway.
19. Spatial distribution of ganglion cell fields
Ganglion cells transmit visual information to the brain as a concert of individual signals arising from multiple cells representing different points in space. Information about visual objects is thus shared in parallel pathways from many ganglion cells. The arrangement of ganglion cells on the retinal surface is not spatially random. Each cell type is distributed in an ordered mosaic. Within each mosaic cells tend to be spaced apart so as not to occupy a neighboring cell’s territory (W_ssle et al., 1981a). Characteristically the ‘nearest neighbor distances’ are greater than would be expected of a random distribution. Cells of different types may be closely spaced, however. The mosaics of different cell types are said to be independent. Receptive and dendritic fields of cells within a mosaic partially overlap.
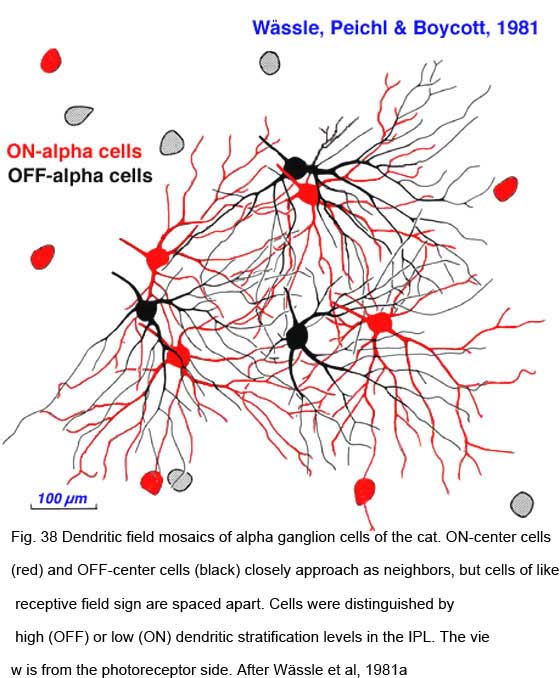 |  |
Neighboring ON- and OFF-center alpha cells position themselves in space in characteristic ways (Fig. 38). In the mosaic of ON-center cells, neighbors do not approach each other closely, maintaining an ‘arms length’ spacing, close enough to ‘shake hands’ with the distal dendrites of neighboring ON cells, but rarely closer. A similar spacing occurs among OFF center cells. ON and OFF center cells appear mutually indifferent to each other’s presence, and may approach closely without an exclusionary zone. These cell types are said to occupy independent lattices (Wässle et al, 1981a). ON and OFF Y cells are thought to illustrate general relationships within and among lattices.
Receptive fields and dendritic fields are similarly spaced. Multielectrode arrays allow simultaneous recording of all ganglion cell light responses in a patch of retina, characterization of trigger features, and mapping of receptive fields (DeVries and Baylor, 1997). Such studies show that receptive fields of ganglion-cell types having common trigger features approach each other only at the edges. When spatial profiles are fit with 2 dimensional Gaussian functions, receptive field centers are typically 2 Gaussian radii apart. In this arrangement, summation of sensitivities from all cells of a given type leads to a flat sensory surface (Devries and Baylor, 1997).
20. Ganglion cell mosaics and spatial resolution
The lattice spacing of ganglion cell receptive field centers may limit certain forms of visual acuity, according to the Nyquist limit. (Wässle and Boycott, 1991, DeVries and Baylor, 1997). To unambiguously define the spatial grain of a periodic pattern, grating or spatial sine wave, at least 2 cellular detectors are required, spaced closely enough that if one is at the peak of brightness of a repeating pattern, the other is at the trough. If multiple peaks and troughs occur in the space intervening between the two closest cells, signals will, of course, be detected in both, but can not unambiguously be associated with any single spatial periodicity. In fact excitation patterns similar to those produced by low frequency patterns (wide spacing of peaks and troughs) may be produced by high spatial frequency patterns. This is called spatial aliasing. DeVries and Baylor (1997) argue that spatial integration within the ganglion cell receptive field acts as a spatial low-pass filter to attenuate signals from very high spatial frequencies, preventing detection, so that such ambiguities do not arise.
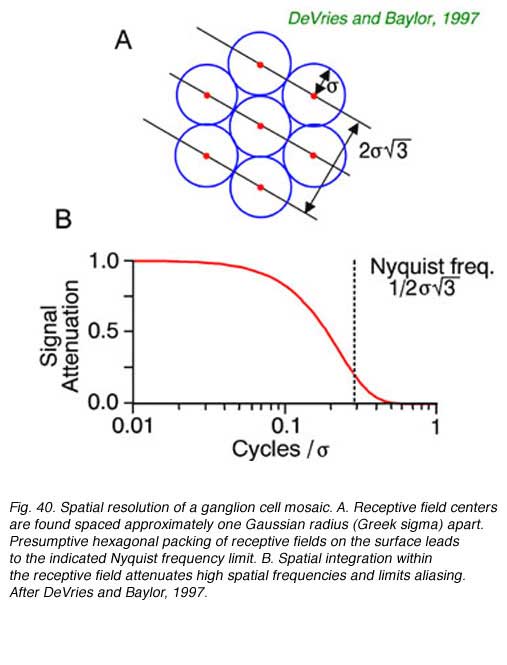 Spatial resolution of ganglion cells and the spacing of receptive field centers appears approximately equal (Wässle and Boycott, 1991, DeVries and Baylor, 1997). Given this observed relationship, the spatial low-pass filtering action of ganglion cell receptive fields would appear to attenuate periodic patterns at or above the Nyquist limit by about a factor of five or more (Fig. 40 B) thus reducing the likelihood of detecting potentially confusing higher spatial frequencies with potential for aliasing. The ability to resolve regularly repeating spatial patterns such as spatial sine waves is a good proxy for spatial resolution in general, since all spatial patterns can be represented, in Fourier fashion, by sums of orthogonal spatial sine waves.
Arguments concerning ganglion cell spacing and visual system spatial performance are constrained by several caveats. First visual space is covered by many cell mosaics. One must carefully consider which mosaic might be limiting for the task at hand, or if any one mosaic need be. Second, as previously discussed, stimulus movements much finer than any retinal cell mosaic spacing can be detected by ganglion cells, if not precisely localized (Shapley and Victor, 1986). This is referred to as visual hyperacuity (Westhiemer,1979). Finally it is well to recall that older style video cameras achieved high spatial resolution without any mosaic of discrete detectors. ‘Newvicon’ tubes employed a single photosensitive surface, scanned by a single electron beam. Spatial resolution was excellent. If the visual system were supplied data about the velocity of image motion, even a single cell might in principle attain spatial resolution unconstrained by Nyquist mosaic limits.
21. Correlated firing of neighboring ganglion cells
Ganglion cell fields partially overlap in visual space. Ganglion cells, moreover, share an overlapping neural substrate composed of retinal interneurons and circuitry. Synchronous chemical synaptic signals from individual amacrine and bipolar cells are distributed onto multiple ganglion cells. Such signals may spread among these presynaptic elements through mutual interconnections by electrical junctions. Finally ganglion cells themselves intercommunicate through electrical junctions. So although ganglion cells eagerly stake out their own individual turf in a spatial anatomical sense, the physiological signals they transmit are often plagiarized from common sources, resulting in highly correlated firing patterns among neighboring cells.
Such cross correlations in firing pattern may be significant centrally where signals converge on common neurons in the brain centers. Synapses that are simultaneously activated tend to be mutually strengthened. Such synapses are often called ‘Hebian’, and are thought to be reinforced by calcium entry thorough simultaneously active synapses. Calcium enters through synapses containing the glutamatergic NMDA receptor. The physiological effect is referred to as long term potentiation (LTP), wherein synaptic currents become larger with repeated stimulation.
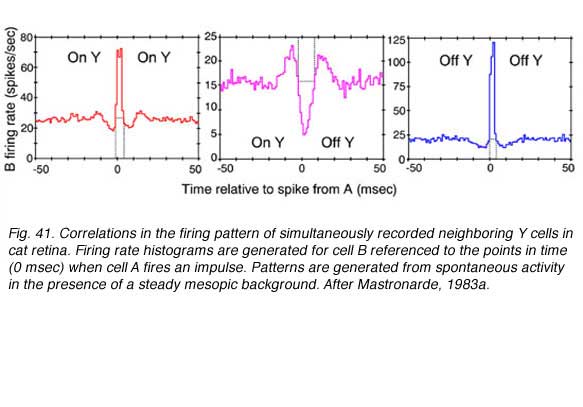 Cross correlations are generated from simultaneous recording of 2 ganglion cell spike trains. Impulses from the first cell set the zero time around which impulse firing rate histograms for the second cell are generated. The histogram is accumulated for every impulse fired by the first cell. When two neighboring ON-center cells are so paired, a large central peak in firing rate for the second ON cell is seen (Fig. 41, red , left). A similar pattern is seen when 2 OFF cells are recorded (Fig. 41, blue right). In both cases increased firing rate represents an increased likelihood that if one cell fires, the other will also. Impulse generation in the two cells is not independent. The cells share common excitatory inputs sources, and are likely to be simultaneously excited. There is symmetry about the zero time axis. This is consistent with the idea that the cells share one or more common excitatory inputs, and that either one may respond first.
When an OFF cell and an ON cell are simultaneously recorded, the situation is different. There is a large central trough in the firing rate from the second cell (Fig. 14 center, magenta). When one cell fires a spike, the other is inhibited from firing, regardless of whether it is the ON cell that fires, or the OFF. There appear to be common, spontaneously active inputs for both cells, inhibitory for one, while excitatory for the other.
Symmetry about the time zero axis suggests that in fact two symmetric inputs are required: One inhibiting the ON cell while exciting the OFF cell, and the other exciting the ON cell while inhibiting the OFF cell. Physiologically ON and OFF ganglion cell mosaics are not independent then. Mutual inputs are found. Such inputs occur, however, only for cells with overlapping, or partially overlapping receptive fields, as is also the case for paired ON or paired OFF cells (Mastronarde, 1983a).
In the illustration (Fig. 41), the events induced the altered firing probability to last 10 msec or less. These were described as arising from spontaneously active inputs, best observed in moderately light adapted preparations (Mastronarde, 1983a). As progressively dimmer backgrounds were employed, other cross correlations with longer durations (50 msec or longer) were observed. These were associated with quantum detection by rods (Mastronarde 1983b). Finally shorter duration events were also observed and appeared associated with direct electrical interconnections between neighboring cells of the same center response polarity (Matronarde, 1983c). There appear to be multiple mechanisms of different temporal duration leading to synchronization of firing among neighboring cells.
Among the multiple mechanisms of different temporal duration leading to synchronization of firing among neighboring cells, even some of the longer duration cross correlations between neighboring ganglion cells appear also to be mediated by electrical junctions.
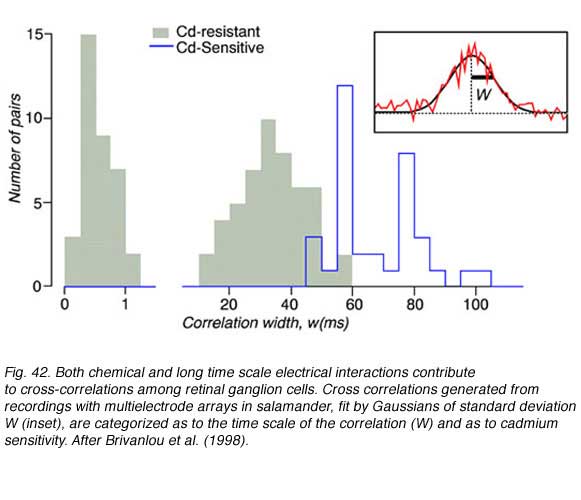
Three cross correlation patterns of different durations were identified among salamander ganglion cells, narrow (0-1 msec), medium (10-50 msec), and broad (50-100 msec). Broad correlations were blocked by cadmium chloride containing medium, but narrow and medium correlations were not (Fig. 42). Cadmium chloride blocks calcium dependent synaptic transmission, making it very likely that both narrow and medium time correlations were mediated by other means such as electrical junctions. Direct electrical connections among ganglion cells may mediate narrow correlations, similar to cat retina, while medium correlations may result from electrical coupling between amacrine and ganglion cells. Waves of slow potentials passing through the amacrine layer may stimulate multiple ganglion cells by this mechanism. The cadmium sensitive broad correlations appear to result, at least in part, from photoreceptor photon noise (Brivanlou et al, 1998), as in the cat.
Only time invariant background stimulation was used in the previous two studies. When localized flashing stimuli are used, a further cross correlation pattern emerges. Oscillatory firing patterns become entrained among cells responding to a contiguous stimulus.
 Ganglion cells develop a high frequency (~100 Hz) oscillatory firing pattern when presented with localized bright stimuli. This is seen in autocorrelation functions (black, Fig. 43). These functions show that the probability of a second ganglion cell impulse depends, in a periodic way, on the firing of a previous impulse in the same cell. If stimuli are spatially separate (left, Fig. 43) the oscillatory firing patterns in the two cells are independent. However, if the stimulus covers the area between the two cells, oscillatory patterns in each cell becomes entrained with each other. This is seen in an oscillatory cross correlation function in the two cells firing patterns for this stimulus (right, Fig. 43). This is a long range effect. The two ganglion cells needn’t have overlapping receptive fields. It is a longer distance phenomenon than reported for other cross correlation patterns in ganglion cell firing. It likely involves gap junctions among ganglion or amacrine cells (Neuenschwander and Singer, 1996).
22. Neurotransmitter receptors and synaptic currents
Ganglion cells are tiny, information processing, neural machines.They extract features of the visual world, encode them in frequency modulated spike trains, and send them coursing along optic nerve axons to various visual brain centers. The first step in this process is the binding of amacrine and bipolar cell neurotransmitters onto specialized receptor proteins embedded in ganglion cell dendritic membrane. These receptor molecules are concentrated at sites of synapses with amacrine and bipolar cells. Once the neurotransmitter is bound, ion selective channels, a kind of micropore in the subsynaptic membrane, open. Charged ionic species rush through these channels, driven by electrochemical gradients. As a consequence current flows into the cell altering membrane potential. These synaptic currents, through a complex interplay of dendritic structure and other potential sensitive ion channels (Fohlmeister and Miller, 1997), alter ganglion cell firing rates, and convey visual signals to the brain.
There are 8 synaptic ion channel associated retinal neurotransmitter receptors . Such receptors are referred to as ‘ionotropic’. Glutamate, the most common excitatory neurotransmitter, activates three distinct channels: AMPA type channels, kainate type channels, and NMDA type channels. Acetyl choline is a further excitatory neurotransmitter active at nicotinic receptors. Excitatory receptors are associated with channels selective for positively charged ionic species, monovalent or divalent cations. When open they allow positive charges to enter neurons, depolarizing them and exciting impulse firing. GABA and glycine are inhibitory ionotropic neurotransmitters. GABA activates two distinct ionotropic receptor types: the bicuculline sensitive GABAA receptor and the bicuculline insensitive GABAC receptor. Bicuculline is a convulsant, and a common blocker of GABA inhibitory action. GABA and glycine open channels selective for the negatively charged chloride anion, which hyperpolarizes neurons and inhibits impulse firing. In teleost fish retinas a further inhibitory chloride selective channel present in bipolar cells has been found activated by glutamate. All these ionotropic receptors are heteropolymers composed typically of 5 subunits. There are multiple alleles of these subunits allowing for considerable heterogeneity in receptor composition and details of function.
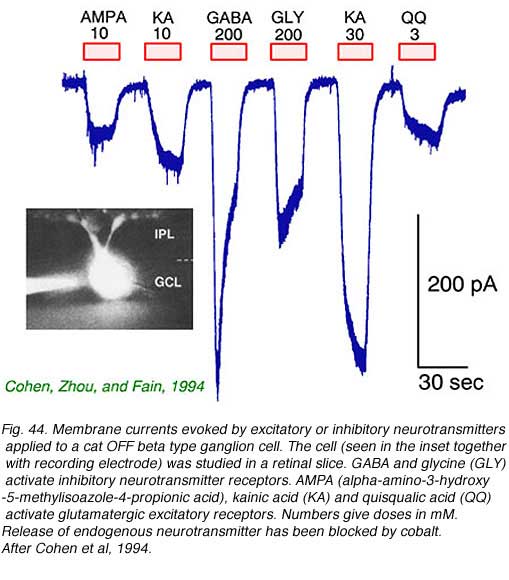 | 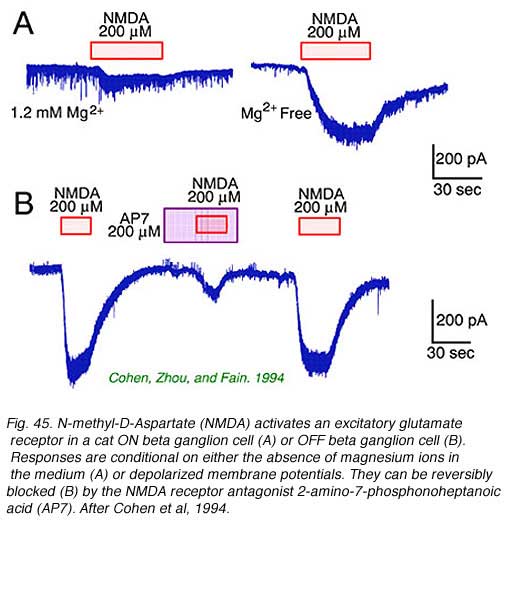 |
Retinal ganglion cells respond to all common excitatory or inhibitory retinal neurotransmitters. When neurotransmitters are applied to the solution bathing ganglion cells, membrane currents are induced. AMPA, kainate (Fig. 44) or NMDA evoke excitatory currents in both ON and OFF type cat beta cells (Cohen et al, 1994). NMDA currents are of the typical ‘conditional’ sort, dominant only if cells are depolarized first by other excitatory neurotransmitters, or in the absence of extracellular magnesium (Fig. 45). Extracellular acetylcholine also excites retinal ganglion cells (Masland and Ames, 1976; Lipton et al, 1987; Cohen et al, 1994).
The bath applied, inhibitory retinal neurotransmitters GABA and glycine potently evoke inhibitory currents in ganglion cells. GABA receptors in cat beta cells are of the ‘A’ type. These responses can be largely blocked by the GABA antagonist bicuculline. Strychnine effectively blocks glycine-evoked currents (Cohen et al, 1994).
Ganglion cell membranes appear to be broadly tuned to receive signals from many neurotransmitter systems. Rather than being neurotransmitter selective, they limit input of information from amacrine and bipolar cells by selective synaptic connections. Thus it is important to study the properties of responses evoked by natural photic stimulation to determine which of the available transmitter systems in the retinal inner plexiform layer are actually utilized. In extracellular impulse recordings, metabotropic glutamate receptors were shown important for the ON center circuit in cat alpha and beta ganglion cells, whereas both these receptors and glycine receptors were found important for OFF alpha and beta cells (Müller et al,1988). To determine whether either of these systems operates directly on the ganglion cell itself it is necessary to measure light-evoked conductance changes in intracellular ganglion cell recordings.
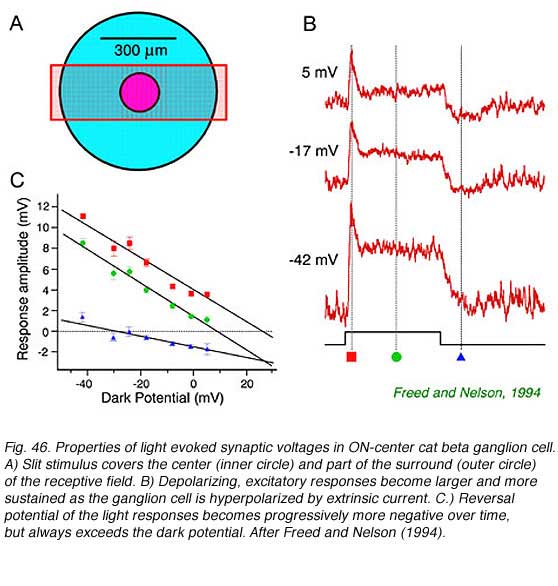 Central illumination of an ON-center ganglion cells depolarizes the cell membrane. Much of the normally inside negative resting potential is lost. The action excites nerve impulse activity. There is an increase in membrane conductance with a reversal potential near zero mV, typical of an open ion channel selectively permeable to cations. This synaptic mechanism causes light responses to increase in amplitude as the cell is hyperpolarized by extrinsic current. The picture is consistent with the activation of ionotropic glutamate receptors permeable to sodium, potassium, and perhaps calcium ions (Belgum et al, 1982, Freed and Nelson, 1994). In the cat ON-beta ganglion cell (Fig. 46) reversal potentials were found to shift to more negative values over the time course of the response. This appears to result from delayed activation of inhibitory synaptic currents with negative reversal potentials. Such inhibition arises in part from the receptive field surround, but also may be intrinsic to the center mechanism. A simple circuit involving excitatory ionotropic glutamate impingement from narrow field bipolar cells, and a more protracted GABAergic and/or glycinergic input from broader field amacrine cells serves to model such results. ON-center ganglion cells may receive tonic inhibitory input in the dark as well (Belgum et al, 1982).
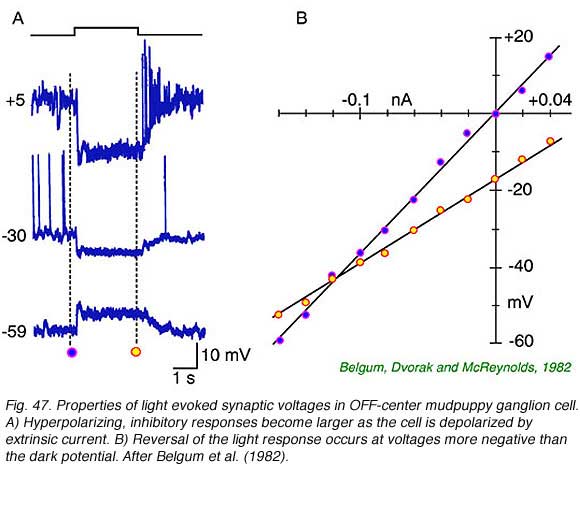 Central illumination of OFF-center ganglion cells hyperpolarizes the cell membrane. The normally inside negative cell potential increases in magnitude. This action reduces nerve impulse activity and causes the cell to become quiet. Concomitantly there is an increase in membrane conductance with a reversal potential more negative than the resting potential. This is typical of the opening of channels selectively permeable to the chloride anion. (Belgum et al, 1982). A simple circuit involving narrow-field GABA or glycine releasing amacrine cells which are themselves excited by light serves to model the OFF center response.
The neural circuits of ON and OFF center ganglion cells appear asymmetric. One might have expected the activity of OFF-center cells to be diminished in the light principally through loss of excitatory input from OFF-center bipolar cells. Yet it is amacrine inhibition that appears key to the physiology of these cells. There is evidence of excitatory input from bipolar cells at stimulus offset. At this point in time there is a burst of action potentials driven by excitatory, depolarizing synaptic input. This appears to be the role for glutamate released from OFF bipolar cells onto OFF-center ganglion cells. There may also be a low level of dark excitation of these cells contributed by OFF-center bipolar cell input (Belgum et al, 1982). There is as yet little evidence concerning synaptic mechanisms involved in the excitatory surround responses of these cells.
23. Ganglion cells that are involved in the circadian clock
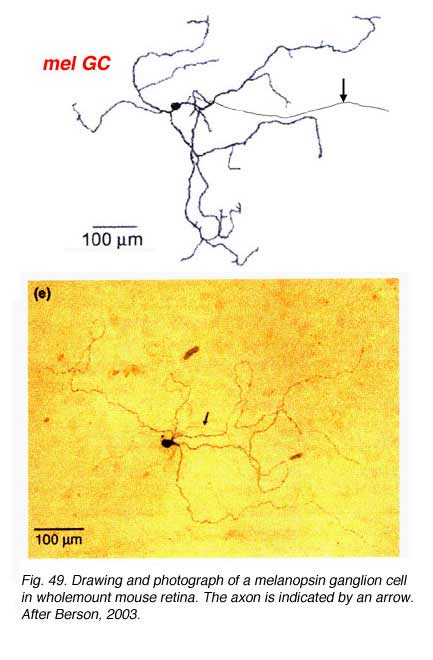
Certain large-field, sparsely-branching ganglion cell types are known to project to the hypothalamic suprachiasmatic nucleus (SCN) in the brain (Fig. 49).
The latter nucleus is the primary circadian oscillator in mammals and is essentially the biological clock allowing resetting of bodily functions to local time. The ganglion cells involved in entraining the circadian clock project from the eye to the SCN via the retinohypothalamic tract (RHT) (Fig. 48).
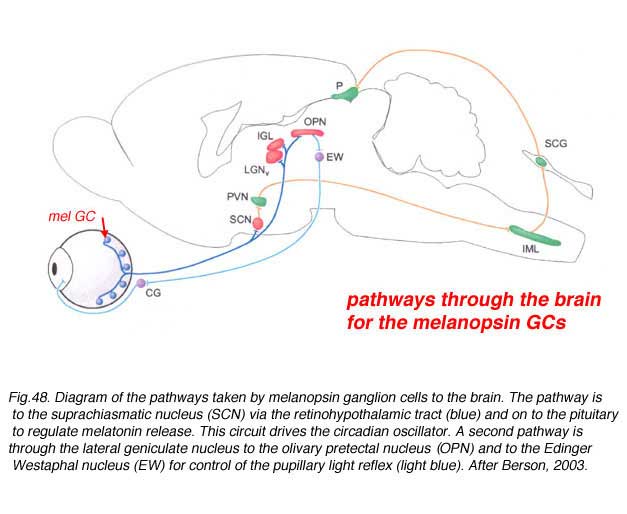
They apparantly contain the neuropeptide pituitary adenylate cyclase activating polypeptide (PCAP) as well as glutamate. They receive input in the inner plexiform layer from amacrine cells and cone bipolar cell axons (Belenky, 2003). These ganglion cells are now known to contain a photoreceptive pigment – melanopsin – in their dendrites, proximal axons and cell membranes, and are thus intrisically photreceptive. In other words, they do not need the input of rods and cones to activate them to light; they can signal luminance levels at least, independently of the photoreceptor bipolar chain of input (Foster et.al. 1991; Berson, 2003). The responses of these melanopsin ganglion cells are slow sluggish depolarizations in contrast to the faster hyperpolarizing responses of rods and cones (Fig. 50). They are probably the equivalent ganglion cells to those described by Barlow and Levick as luminance units in 1969 and described by Pu in 1999 both in cat retina. The action spectrum of the melanopsin ganglion cells appears to be due to an opsin like pigment but it is most sensitive at 484 nm compared with rods at 500 nm and cones at 510 (green cones) and 359 nm (uv cones) in the mouse (Berson, 2003) (Fig. 50). The melanopsin ganglion cels are also thought to be involved in the pupillary light reflex for they also project to the lateral geniculate nucleus through the olivary pretectal nucleus (OPN) and on to the Edinger Westaphal nucleus (EW) for control of the pupillary light reflex (Fig. 48, light blue pathway).
24.References
- Ammermuller J, Muller J, Kolb H. The organization of the turtle inner retina. II. Analysis of color-coded and directionally selective cells. J Comp Neurol.1995;358:35–62. [PubMed]
- Amthor FR, Oyster CW, Takahashi ES. Morphology of ON-OFF direction-selective ganglion cells in the rabbit retina. Brain Res. 1984;298:187–190. [PubMed]
- Amthor FR, Takahashi ES, Oyster CW. Morphologies of rabbit retinal ganglion cells with concentric receptive fields. J Comp Neurol. 1989;280:72–96. [PubMed]
- Amthor FR, Takahashi ES, Oyster CW. Morphologies of rabbit retinal ganglion cells with complex receptive fields. J Comp Neurol. 1989;280:97–121. [PubMed]
- Barlow HB, Hill RM. Selective sensitivity to direction of movement in ganglion cells of the rabbit retina. Science. 1963;139:412–414. [PubMed]
- Barlow HB, Hill RM, Levick WR. Retinal ganglion cells responding selectively to direction and speed of image motion in the rabbit. J Physiol. 1964;173:377–407.[PubMed]
- Barlow HB, Levick WR. The mechanism of directionally selective units in the rabbit’s retina. J Physiol. 1965;178:477–504. [PubMed]
- Barlow HB, Levick WR. Changes in the maintained discharge with adaptation level in the cat retina. J Physiol. 1969;202:699–718. [PubMed] [Free Full text in PMC]
- Barlow HB, Levick WR, Yoon M. Responses to single quanta of light in retinal ganglion cells of the cat. Vision Res. 1971;3:87–101. [PubMed]
- Baylor DA, Fettiplace R. Transmission from photoreceptors to ganglion cells in turtle retina. J Physiol. 1977;271:391–424. [PubMed] [Free Full text in PMC]
- Belenky MA, Smeraski CA, Provencio I, Sollars PJ, Pickard GE. Melanopsin retinal ganglion cells receive bipolar and amacrine cell synapses. J Comp Neurol.2003;460:380–393. [PubMed]
- Belgum JH, Dvorak DR, McReynolds JS. Sustained synaptic input to ganglion cells of mudpuppy retina. J Physiol. 1982;326:91–108. [PubMed] [Free Full text in PMC]
- Berson DM. Strange vision: ganglion cells as circadian photoreceptors. Trends Neurosci. 2003;26:314–320. [PubMed]
- Borg-Graham L. Conductance changes are greater from preferred versus null responses in directionally-selective retinal ganglion cells. Soc Neurosci Abstr.1997;23:2360.
- Brivanlou IH, Warland DK, Meister M. Mechanisms of concerted firing among retinal ganglion cells. Neuron. 1998;20:527–539. [PubMed]
- Cleland BG, Dubin MW, Levick WR. Sustained and transient neurones in the cat’s retina and lateral geniculate nucleus. J Physiol. 1971;217:473–496. [PubMed] [Free Full text in PMC]
- Cleland BG, Levick WR. Brisk and sluggish concentrically organised ganglion cells in the cat’s retina. J Physiol. 1974;240:421–456. [PubMed] [Free Full text in PMC]
- Cleland BG, Levick WR. Properties of rarely encountered types of ganglion cells in the cat’s retina. J Physiol. 1974;240:457–492. [PubMed] [Free Full text in PMC]
- Cohen ED, Zhou ZJ, Fain GL. Ligand-gated currents of alpha and beta ganglion cells in the cat retinal slice. J Neurophysiol. 1994;72:1260–1269. [PubMed]
- Cohen ED, Miller RF. Quinoxalines block the mechanism of directional selectivity in ganglion cells of the rabbit retina. Proc Natl Acad Sci U S A. 1995;92:1127–1131. [PubMed] [Free Full text in PMC]
- Criswell MH.Cellular mechanisms of movement detection and directionality in the turtle retina [dissertation]. Bloomington (IN): Indiana University; 1997.
- Crocker RA, Ringo J, Wolbarsht ML, Wagner HG. Cone contributions to cat retinal ganglion cell receptive fields. J Gen Physiol. 1980;76:763–785. [PubMed]
- Cronly-Dillon JR. Units sensitive to direction of movement in goldfish optic tectum. Nature. 1964;203:214–215. [PubMed]
- Dacey DM, Lee BB. The ‘blue-on’ opponent pathways in primate retina originates from a distinct bistratified ganglion cell. Nature. 1994;367:731–735. [PubMed]
- Daw NW. Goldfish retina: organization for simultaneous color contrast. Science. 1967;158:942–944. [PubMed]
- Daw NW. Colour-coded ganglion cells in the goldfish retina: extension of their receptive fields by means of new stimuli. J Physiol. 1968;197:567–592. [PubMed] [Free Full text in PMC]
- Daw NW, Pearlman AL. Cat colour vision: One cone process or several? J Physiol. 1969;201:745–764. [PubMed] [Free Full text in PMC]
- Daw NW, Pearlman AL. Cat colour vision: evidence for more than one cone process. J Physiol. 1970;211:125–137. [PubMed] [Free Full text in PMC]
- Daw NW, Ariel M. Effect of synaptic transmitter drugs on receptive fields of rabbit ganglion cells. Vision Res. 1981;21:1643–1648. [PubMed]
- De Monasterio FM, Gouras P. Functional properties of ganglion cells of the rhesus monkey retina. J Physiol. 1975;251:167–195. [PubMed] [Free Full text in PMC]
- DeVries SH, Baylor DA. An alternative pathway for signal flow from rod photoreceptors to ganglion cells in mammalian retina. Proc Natl Acad Sci U S A.1995;92:10658–10662. [PubMed] [Free Full text in PMC]
- DeVries SH, Baylor DA. Mosaic arrangement of ganglion cell receptive fields in rabbit retina. J Neurophysiol. 1997;78:2048–2060. [PubMed]
- Dowling JE. Organization of vertebrate retinas. Invest Ophthalmol. 1970;9:655–680. [PubMed]
- Enroth-Cugell C, Robson JG. The contrast sensitivity of retinal ganglion cells of the cat. J Physiol. 1966;187:517–552. [PubMed] [Free Full text in PMC]
- Enroth-Cugell C, Hertz BG, Lennie P. Convergence of rod and cone signals in the cat’s retina. J Physiol. 1977;269:297–318. [PubMed] [Free Full text in PMC]
- Fohlmeister JF, Miller RF. Mechanisms by which cell geometry controls repetitive impulse firing in retinal ganglion cells. J Neurophysiol. 1997;78:1948–1964.[PubMed]
- Foster RG. Shedding light on the biological clock. Neuron. 1998;20:829–832. [PubMed]
- Freed MA, Nelson R. Conductances evoked by light in the ON-beta ganglion cell of the cat retina. Vis Neurosci. 1994;11:261–269. [PubMed]
- Gouras P. The effects of light-adaptation on rod and cone receptive field organization of monkey ganglion cells. J Physiol. 1967;192:747–760. [PubMed] [Free Full text in PMC]
- Gouras P. Identification of cone mechanisms in monkey ganglion cells. J Physiol. 1968;199:533–547. [PubMed] [Free Full text in PMC]
- Gouras P. Antidromic response of orthodromically identified ganglion cells in monkey retina. J Physiol. 1969;204:407–419. [PubMed] [Free Full text in PMC]
- Gouras P. The function of the midget cell system in primate color vision. Vision Res. 1971;3:397–410. [PubMed]
- Granit R. Sensory mechanisms of the retina. London: Oxford University Press; 1947.
- Grzywacz NM, Amthor FR. Facilitation in ON-OFF directionally selective ganglion cells of the rabbit retina. J Neurophysiol. 1993;69:2188–2199. [PubMed]
- Grzywacz NM, Tootle JS, Amthor FR. Is the input to a GABAergic or cholinergic synapse the sole asymmetry in rabbit’s retinal directional selectivity? Vis Neurosci.1997;14:39–54. [PubMed]
- Hartline HK. The response of single optic nerve fibers of the vertebrate eye to illumination of the retina. Am J Physiol. 1938;121:400–415.
- Hartline HK. The receptive fields of optic nerve fibers. Am J Physiol. 1940;130:690–699.
- Hartline HK. The effects of spatial summation in the retina on the excitation of the fibers of the optic nerve. Am J Physiol. 1940;130:700–711.
- Hartline HK. Visual receptors and retinal interaction. Science. 1969;164:270–278. [PubMed]
- He S, Masland RH. Retinal direction selectivity after targeted laser ablation of starburst amacrine cells. Nature. 1997;389:378–382. [PubMed]
- Hering E. Grundzuge einer theorie des Farbensinnes Sitzungsber. k. Akad. Wissensch, Math-naturwissensch. Cl. Wein. 1875;70:169.
- Holden AL. Responses of directional ganglion cells in the pigeon retina. J Physiol. 1977;270:253–269. [PubMed] [Free Full text in PMC]
- Jacobson M, Gaze RM. Type of visual response from single units in the optic tectum and optic nerve of the goldfish. Q J Exp Physiol. 1964;49:199–209.
- Jensen RJ, DeVoe RD. Comparisons of directionally selective with other ganglion cells of the turtle retina: intracellular recording and staining. J Comp Neurol.1983;217:271–287. [PubMed]
- Jensen RJ. Involvement of glycinergic neurons in the diminished surround activity of ganglion cells in the dark-adapted rabbit retina. Vis Neurosci. 1991;6:43–53.[PubMed]
- Kaneda M, Hashimoto M, Kaneko A. Neuronal nicotinic acetylcholine receptors of ganglion cells in the cat retina. Jpn J Physiol. 1995;45:491–508. [PubMed]
- Kaplan E, Shapley RM. The primate retina contains two types of ganglion cells, with high and low contrast sensitivity. Proc Natl Acad Sci U S A. 1986;83:2755–2757. [PubMed] [Free Full text in PMC]
- Kittila CA, Granda AM. Functional morphologies of retinal ganglion cells in the turtle. J Comp Neurol. 1994;350:623–645. [PubMed]
- Kittila CA, Massey SC. Effect of ON pathway blockade on directional selectivity in the rabbit retina. J Neurophysiol. 1995;73:703–712. [PubMed]
- Kuffler SW. Discharge patterns and functional organization of mammalian retina. J Neurophysiol. 1953;16:37–68. [PubMed]
- Lee BB, Smith VC, Pokorny J, Kremers J. Rod inputs to macaque ganglion cells. Vision Res. 1997;37:2813–2828. [PubMed]
- Lettvin JY, Maturana HR, McCulloch WS, Pitts WH. What the frog’s eye tells the frog’s brain. Proc Inst Radio Eng N Y. 1959;47:1940–1951.
- Lipton SA, Aizenmann E, Loring RH. Neural nicotinic acetylcholine responses in solitary mammalian retinal ganglion cells. Pflugers Arch. 1987;410:37–43.[PubMed]
- Loop MS, Bruce LL, Petuchowski S. Cat color vision: The effect of stimulus size, shape and viewing distance. Vision Res. 1979;19:507–513. [PubMed]
- MacLeod DIA. Rods cancel cones in flicker. Nature. 1972;235:173–174. [PubMed]
- MacNichol EF. Three-pigment color vision. Sci Am. 1964;211:48–56.
- Mariani AP. Association amacrine cells could mediate directional selectivity in pigeon retina. Nature. 1982;298:654–655. [PubMed]
- Masland RH, Ames A. Responses of acetylcholine of ganglion cells in an isolated mammalian retina. J Neurophysiol. 1976;39:1220–1235. [PubMed]
- Mastronarde DN. Correlated firing of cat retinal ganglion cells. I. Spontaneously active inputs to X- and Y-cells. J Neurophysiol. 1983;49:303–324. [PubMed]
- Mastronarde DN. Correlated firing of cat retinal ganglion cells. II. Responses of X- and Y- cells to single quantal events. J Neurophysiol. 1983;49:325–349.[PubMed]
- Mastronarde DN. Interactions between ganglion cells in cat retina. J Neurophysiol. 1983;49:350–365. [PubMed]
- Maturana HR, Frenc S. Directional movement and horizontal edge detectors in the pigeon retina. Science. 1963;142:977–979. [PubMed]
- Merigan WH, Maunsell JHR. How parallel are the primate visual pathways. Annu Rev Neurosci. 1993;16:369–402. [PubMed]
- Michael CR. Receptive fields of single optic nerve fibers in a mammal with an all-cone retina. II. Directionally selective units. J Neurophysiol. 1968;31:257–267.[PubMed]
- Müller F, Wässle H, Voigt T. Pharmacological modulation of the rod pathway in the cat retina. J Neurophysiol. 1988;59:1657–1671. [PubMed]
- Nelson R, Famiglietti EV, Kolb H. Intracellular staining reveals different levels of stratification for On-and Off-centre ganglion cells in cat retina. J Neurophysiol.1978;41:472–483. [PubMed]
- Nelson R, Kolb H, Freed M. Off-alpha and Off-beta ganglion cells in cat retina. I. Intracellular electrophysiology and HRP stains. J Comp Neurol. 1993;329:68–84.[PubMed]
- Neuenschwander S, Singer W. Long-range synchronization of oscillatory light responses in the cat retina and lateral geniculate nucleus. Nature. 1996;379:728–733. [PubMed]
- Peichl L, Wässle H. Morphological identification of on- and off-centre brisk transient (Y) cells in cat retina. Proc R Soc Lond B Biol Sci. 1981;212:139–156.[PubMed]
- Peichl L, Wässle H. The structural correlate of the receptive field centre of alpha ganglion cells in the cat retina. J Physiol. 1983;341:309–324. [PubMed] [Free Full text in PMC]
- Polyak SL. The retina. Chicago: University of Chicago Press. 1941
- Pu M. Dendritic morphology of cat retinal ganglion cells projecting to suprachiasmatic nucleus. J Comp Neurol. 1999;414:267–274. [PubMed]
- Purpura K, Kaplan E, Shapley RM. Background light and the contrast gain of primate P and M retinal ganglion cells. Proc Natl Acad Sci U S A. 1988;85:4534–4537. [PubMed] [Free Full text in PMC]
- Reid RC, Shapley RM. Spatial structure of cone inputs to receptive fields in primate lateral geniculate nucleus. Nature. 1992;356:716–718. [PubMed]
- Raynauld J-P. Goldfish retina: sign of the rod input in opponent color ganglion cells. Science. 1972;177:84–85. [PubMed]
- Rodieck RW. Quantitative analysis of cat retinal ganglion cell response to visual stimuli. Vision Res. 1965;5:583–601. [PubMed]
- Schmidt M, Humphrey MF, Wässle H. Action and localization of acetylcholine in the cat’s retina. J Neurophysiol. 1987;58:997–1015. [PubMed]
- Shapley RM, Victor JD. Nonlinear spatial summation and the contrast gain control of cat retinal ganglion cells. J Physiol. 1979;290:141–163. [PubMed] [Free Full text in PMC]
- Shapley R, Victor J. Hyperacuity in cat retinal ganglion cells. Science. 1986;231:999–1002. [PubMed]
- Wagner HG, MacNichol EF, Wolbarsht ML. Thee response properties of single ganglion cells in the goldfish retina. J Gen Physiol. 1960;43:45–62. [PubMed]
- Wässle H, Peichl L, Boycott BB. Morphology and topography of on- and off-alpha cells in the cat retina. Proc R Soc Lond B Biol Sci. 1981;212:157–175.[PubMed]
- Wässle H, Boycott BB. Functional architecture of the mammalian retina. Physiol Rev. 1991;71:447–480. [PubMed]
- Werblin FS. Response of retinal cells to moving spots: Intracellular recording in Necturus maculosus. J Neurophysiol. 1970;33:342–350. [PubMed]
- Wiesel TN. Recording inhibition and excitation in the cat’s retinal ganglion cells with intracellular electrodes. Nature. 1959;183:264–265. [PubMed]
- Wiesel TN, Hubel DH. Spatial and chromatic interactions in the lateral geniculate body of the rhesus monkey. J Neurophysiol. 1966;29:1115–1156. [PubMed]
- Westhiemer G. The spatial sense of the eye. Invest Ophthalmol Vis Sci. 1979;18:893–912. [PubMed]
- Wyatt HJ, Daw NW. Specific effects of neurotransmitter antagonists on ganglion cells in rabbit retina. Science. 1976;191:204–205. [PubMed]
- Yang G, Masland RH. Direct visualization of the dendritic and receptive fields of directionally selective retinal ganglion cells. Science. 1992;258:1949–1952.[PubMed]
- Yang G, Masland RH. Receptive fields and dendritic structure of directionally selective retinal ganglion cells. J Neurosci. 1994;14:5267–5280. [PubMed]
- Young T. On the theory of light and colours. Philos Trans R Soc Lond B Biol Sci. 1802;92:20–71.