1. Dark Adaptation.
The eye operates over a large range of light levels. The sensitivity of our eye can be measured by determining the absolute intensity threshold, that is, the minimum luminance of a test spot required to produce a visual sensation. This can be measured by placing a subject in a dark room, and increasing the luminance of the test spot until the subject reports its presence. Consequently, dark adaptation refers to how the eye recovers its sensitivity in the dark following exposure to bright lights. Aubert (1865) was the first to estimate the threshold stimulus of the eye in the dark by measuring the electrical current required to render the glow on a platinum wire just visible. He found that the sensitivity had increased 35 times after time in the dark, and also introduce for the term “adaptation”.
Dark adaptation forms the basis of the Duplicity Theory which states that above a certain luminance level (about 0.03 cd/m2), the cone mechanism is involved in mediating vision; photopic vision. Below this level, the rod mechanism comes into play providing scotopic (night) vision. The range where two mechanisms are working together is called the mesopic range, as there is not an abrupt transition between the two mechanism.
The dark adaptation curve shown below depicts this duplex nature of our visual system (figure 1). The first curve reflects the cone mechanism. The sensitivity of the rod pathway improves considerably after 5-10 minutes in the dark and is reflected by the second part of the dark adaptation curve. One way to demonstrate that the rod mechanism takes over at low luminance level, is to observe the colour of the stimuli. When the rod mechanism takes over, coloured test spots appear colourless, as only the cone pathways encode colour. This duplex nature of vision will affect the dark adaptation curve in different ways and is discussed below.
To produce a dark adaptation curve, subjects gaze at a pre-adapting light for about five minutes, then absolute threshold is measured over time (figure 1). Pre-adaptation is important for normalisation and to ensure a bi-phasic curve is obtained.
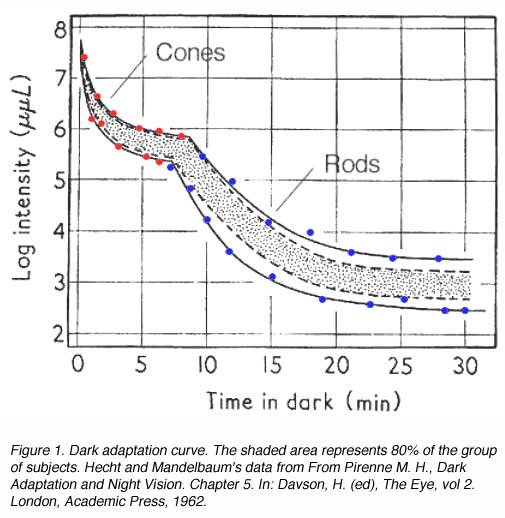
From the above curve, it can be seen that initially there is a rapid decrease in threshold, then it declines slowly. After 5 to 8 minutes, a second mechanism of vision comes into play, where there is another rapid decrease in threshold, then an even slower decline. The curve asymptotes to a minimum (absolute threshold) at about 10-5 cd/m2 after about forty minutes in the dark.
2. Factors Affecting Dark Adaptation.
- Intensity and duration of the pre-adapting light
- Size and position of the retinal are used in measuring dark adaptation
- Wavelength distribution of the light used
- Rhodopsin regeneration
Intensity and duration of pre-adapting light:
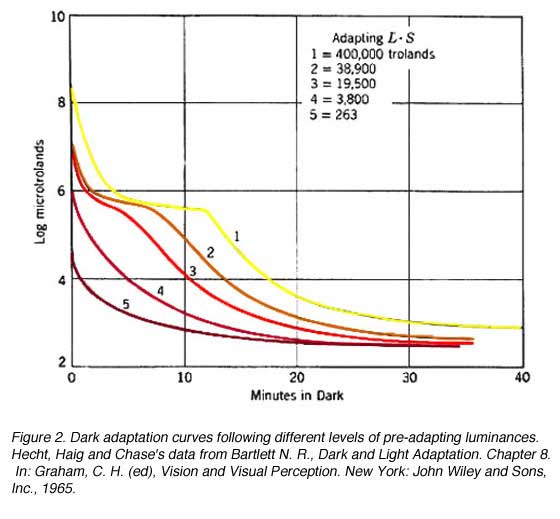
Different intensities and duration of the pre-adapting light will affect dark adaptation curve in a number of areas. With increasing levels of pre-adapting luminances, the cone branch becomes longer while the rod branch becomes more delayed. Absolute threshold also takes longer to reach. At low levels of pre-adapting luminances, rod threshold drops quickly to reach absolute threshold (figure 2).
The shorter the duration of the pre-adapting light, the more rapid the decrease in dark adaptation (figure 3). For extremely short pre-adaptation periods, a single rod curve is obtained. It is only after long pre-adaptation that a bi-phasic, cone and rod branches are obtained.

Size and location of the retina used:
The retinal location used to register the test spot during dark adaptation will affect the dark adaptation curve due to the distribution of the rod and cones in the retinal (figure 4).
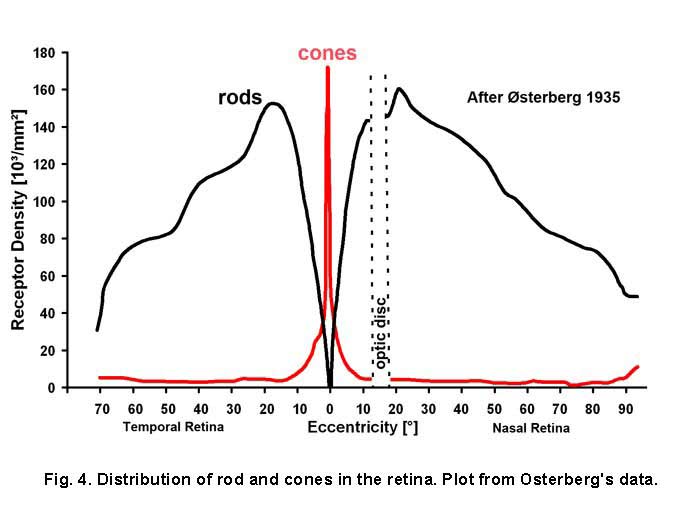
When a small test spot is located at the fovea (eccentricity of 0o), only one branch is seen with a higher threshold compared to the rod branch. When the same size test spot is used in the peripheral retina during dark adaptation, the typical break appears in the curve representing the cone branch and the rod branch (figure 5).

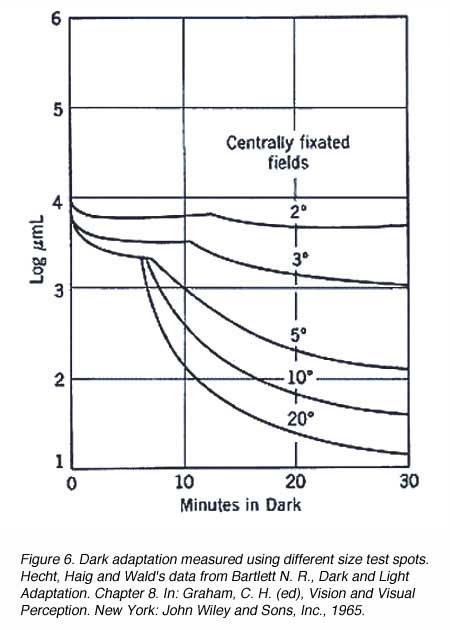
A similar principle applies when different size of the test spot is used. When a small test spot is used during dark adaptation, a single branch is found as only cones are present at the fovea. When a larger test spot is used during dark adaptation, a rod-cone break would be present since the test spot stimulates both cones and rods. As the test spot becomes even larger, incorporating more rods, the sensitivity of the eye in the dark is even greater (figure 6), reflecting the larger spatial summation characteristics of the rod pathway.
Wavelength of the threshold light:
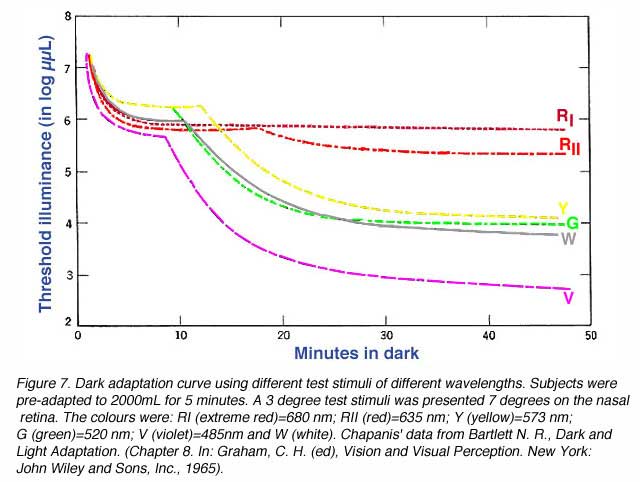
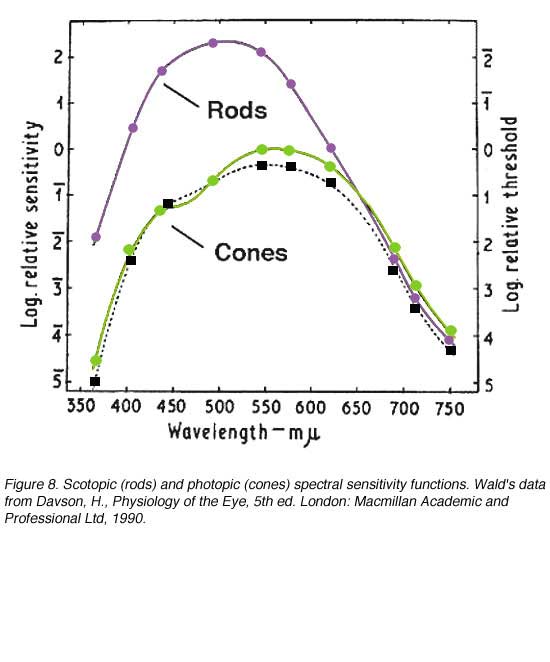
When stimuli of different wavelengths are used, the dark adaptation curve is affected. From figure 7 below, a rod-cone break is not seen when using light of long wavelengths such as extreme red. This occurs due to rods and cones having similar sensitivities to light of long wavelengths (figure 8). Figure 8 depicts the photopic and scotopic spectral sensitivity functions to illustrate the point that the rod and cone sensitivity difference is dependent upon test wavelength (although normalization of spatial, temporal and equivalent adaptation level for the rod and cones is not present in this figure). On the other hand, when light of short wavelength is used, the rod-cone break is most prominent as the rods are much more sensitive than the cones to short wavelengths once the rods have dark adapted.
 Rhodopsin regeneration
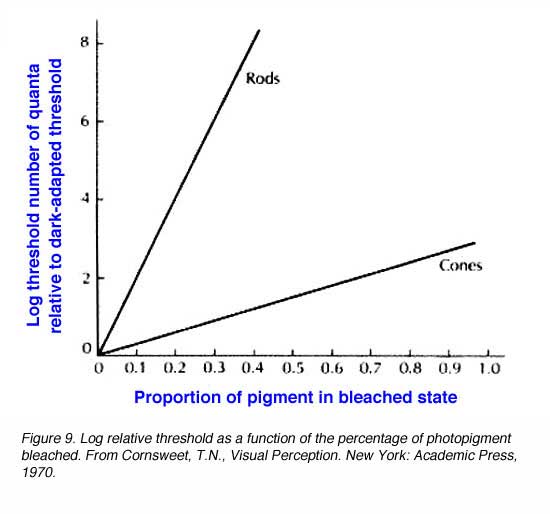
Dark adaptation also depends upon photopigment bleaching. Retinal (or reflection) densitometry, which is a procedure based on measuring the light reflected from the fundus of the eye, can be used to determine the amount of photopigment bleached. Using retinal densitometry, it was found that the time course for dark adaptation and rhodopsin regeneration was the same. However, this does not fully explain the large increase in sensitivity with time. Bleaching rhodopsin by 1% raises threshold by 10 (decreases sensitivity by 10). In figure 9, it can be seen that, bleaching 50% of rhodopsin in rods raises threshold by 10 log units while the bleaching 50% of cone photopigment raises threshold by about one and a half log units. Therefore, rod sensitivity is not fully accounted for at the receptor level and may be explained by further retinal processing. The important thing to note is that bleaching of cone photopigment has a smaller effect on cone thresholds.
 Light Adaptation.
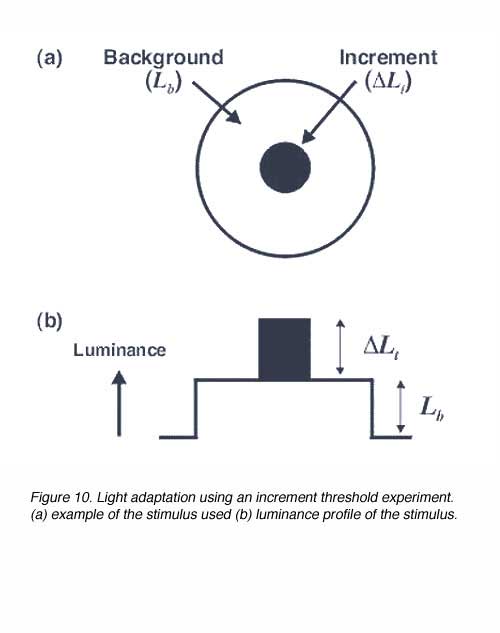
With dark adaptation, we noticed that there is progressive decrease in threshold (increase in sensitivity) with time in the dark. With light adaptation, the eye has to quickly adapt to the background illumination to be able to distinguish objects in this background. Light adaptation can be explored by determining increment thresholds. In an increment threshold experiment, a test stimulus is presented on a background of a certain luminance. The stimulus is increased in luminance until detection threshold is reached against the background (figure 10) Therefore, the independent variable is the luminance of the background and the dependent variable is the threshold intensity or luminance of the incremental test required for detection. Such an approach is used when visual fields are measured in clinical practice.
The experimental conditions shown in figure 10, can be repeated by changing the background field luminance. Depending upon the choice of test and background wavelength, the test size and retinal eccentricity, a monophasic or biphasic threshold versus intensity (tvi) curve is obtained. Figure 11 illustrates such a curve for parafoveal presentation of a yellow test field on a green background. This stimulus choice leads to two branches. A lower branch belonging to the rod system. As the background light level increases, visual function shifts from the rod system to the cone system. A dual-branched curve reflects the duplex nature of vision, similar to the bi-phasic response in the dark adaptation curve.

When a single system (eg. the rod system) is isolated under certain experimental conditions, four sections of the curve is apparent. These experiment conditions involve using a red background to suppress the cone photoreceptors and a green test spot to stimulate the rod photoreceptors (Aguilar and Stiles, 1954). The curve in figure 12 can also be obtained by performing increment threshold experiments on rod monochromats who lack cone photoreceptors. When the rod system is isolated using the conditions of Aguilar and Stiles, four sections are obtained:
- Dark light
- Square Root Law (de Vries-Rose Law)
- Weber’s Law
- Saturation
The threshold in the linear portion of the tvi curve is determined by the dark light level. As background luminance is increased, the curve remains constant (and equal to the absolute threshold). Sensitivity in this section is limited by neural (internal) noise, the so called “dark light”. The background field is relatively low and does not significantly affect threshold. This neural noise is internal to the retina and examples of these include thermal isomerisations of photopigment, spontaneous opening of photoreceptor membrane channels and spontaneous neurotransmitter reléase.
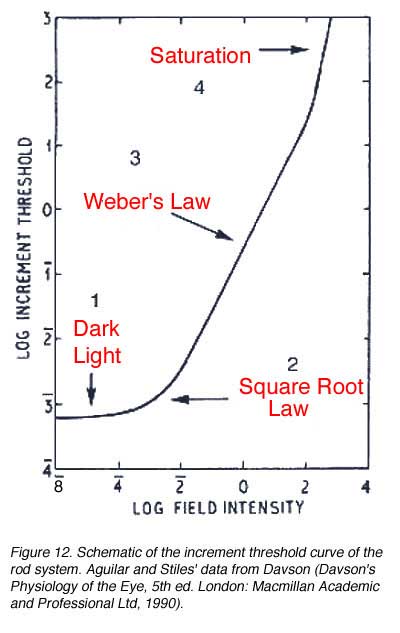
The second part of the tvi curve is called the square root law or (de Vries-Rose Law) region. This part of the curve is limited by quantal fluctuation in the background. Rose (1948) proposed that visual threshold would be quantal limited. The visual system is usually compared to a theoretical construct, an ideal light detector. An ideal detector can detect and encode each absorbed quantum of light and is limited only by the noise due to quantal fluctuations in the source. To detect the stimulus, the stimulus must be sufficiently exceed the fluctuations of the background (noise).
Because the variability in quanta increases with the number of quanta absorbed, threshold would increase with background luminance. In fact, the increase in threshold should be proportional to the square root of the background luminance; hence the slope of one half in a log-log plot. For the rod pathway a slope of 0.6 is often found (Hallett, 1969). Barlow (1958) explored the conditions which influenced the transition from the square root law to Weber’s law (see below). He concluded that for brief, small test spots, increment thresholds rise as the square root of the background over the entire photopic range. Spots of large areas and long durations have slopes close to Weber’s law. Other spatio-temporal configurations result in different proportions of each region.
When plotted using log DL versus log L coordinates, the Weber law section ideally has a slope 1. For the rod pathway, a slope 0.8 or less is found, implying that the rod pathway does operate under true Weber conditions. This section of the curve demonstrates an important aspect of our visual system. Our visual system is designed to distinguish objects from its background. In the real world, objects have contrast, which is constant and independent of ambient luminance. Therefore, the principle of Weber’s law can be applied to contrast which remains constant regardless of illumination changes. This is called contrast constancy or contrast invariance, with this contrast level defined as Webers constant. Contrast constancy can be mathematically expressed as DL /L = constant. DL is the increment threshold on a background L. The constant is also known as the Weber constant or Weber fraction. The Weber constant for the rod and cone is 0.14 (Cornsweet, 1970) and 0.02 to 0.03 (Davson, 1990) respectively. Within the cone pathways, the S-cone pathway, again has a different characteristics to those of the longer-wavelength pathway with a Weber constant of around 0.09 (Stiles, 1959).
Section 4 of the curve (figure 12) shows rod saturation at high background luminance. The slope begins to increase rapidly and the rod system starts to become unable to detect the stimulus. This section of the curve occurs for cone mechanism under high background light levels.
References.
- Aguilar M, Stiles WS. Saturation of the rod mechanism of the reina at high levels of stimulation. Opt Acta (Lond). 1954;1:59–65.
- Aubert H. Physiologie der Netzhaut. Breslau: E. Morgenstern. 1865
- Barlow HB. Increment thresholds at low intensities considered as signal noise discriminations. J Physiol. 1958;141:337–350. [PubMed]
- Barlow HB. The physical limits of visual discrimination. In: Giese A. C. (ed), Photophysiology. Chapter 16. New York: Academic Press 1964.
- Bartlett NR. Dark and light adaptation. In: Graham CH, editor. Vision and visual perception. New York: John Wiley and Sons, Inc.; 1965.
- Cornsweet TN. . Visual perception. New York: Academic Press. 19707.Davson H. . Physiology of the eye. 5th ed. London: Macmillan Academic and Professional Ltd. 1990
- Davson H (1990) Physiology of the Eye, 5th ed. London: Macmillan Academic and Professional Ltd.
- Hallett PE. The variations in visual threshold measurement. J Physiol. 1969;202:403–419. [PubMed] [Free Full text in PMC]
- Osterberg G. Topography of the layer of rods and cones in the human retina. Acta Ophthalmol Suppl. 1935;6:1–103.
- Pirenne MH (1962) Dark Adaptation and Night Vision. Chapter 5. In: Davson, H. (ed), The Eye, vol 2. London, Academic Press.
- Pirenne MH (1962) Rods and Cones. Chapter 2. In: Davson, H. (ed), The Eye, vol 2. London, Academic Press.
- Rose A. The sensitivity performance of the human eye on a absolute scale. J Opt Soc Am. 1948;38:196–208. [PubMed]
- Stiles WS. Colour vision: the approach through increment threshold sensitivity. Proc Natl Acad Sci U S A. 1959;75:100–114.
The autor
Michael Kalloniatis was born in Athens Greece in 1958. He received his optometry degree and Master’s degree from the University of Melbourne. His PhD was awarded from the University of Houston, College of Optometry, for studies investigating colour vision processing in the monkey visual system. Post-doctoral training continued at the University of Texas in Houston with Dr Robert Marc. It was during this period that he developed a keen interest in retinal neurochemistry, but he also maintains an active research laboratory in visual psychophysics focussing on colour vision and visual adaptation. He was a faculty member of the Department of Optometry and Vision Sciences at the University of Melbourne for some years, moved to New Zealandas the Robert G. Leitl Professor of Optometry, Department of Optometry and Vision Science, University of Auckland. Since 2008 Mike has returned to Syney, Australia as a Faculty member at the University of New South Wale, and is now Director, Centre for Eye Health, an initiative of Guide Dogs NSW/ACT and the University of New South Wales (UNSW). E-mail to m.kalloniatis@unsw.edu.au