
1. Introduction.
From the earliest dawn of history, man must have wondered how the outside world became apparent to him through his eyes. He must have pondered what forces cause an observing eye to see an object. Why did the world look light or dark or nature have such bright colors? Even though early man could not understand the concept of the physics of light or that perception occurred in the brain, he must have understood that the eye was the organ of vision and without eyes we were blind. Thus, the earliest concerns of the ancient civilizations of India, Babylon, China and Egypt were certainly to attempt to restore or improve eye sight when it was failing even without understanding much else. It was the Greek philosophers (Hippocrates, Aristotle, Plato) who provided the first known theories concerning the eye, its function, anatomy and treatment. Originally the Aristotelean idea was that rays of light eminated from the eyes to illuminate the world around. When it was dark, the air became murky so the rays could not penetrate but a candle could burn off the opacity in the air allowing sight to penetrate. Also strangely enough the Homeric Greeks lacked a word for blue. Homer described the sea as “wine colored”.
Eventually, Aristotle proposed that visual sensation passed from the eye to the heart which was at that time considered the center of sensation and psychic function. The brain was thought to be a cooling device (Jung, 1984). This cardiocentric nature of sensation, continued into the middle ages (as depicted by the sixteenth century illustration, Fig. 1), despite the direct experimental evidence of Galen (A.D. 129-200). Galen, a Greek scientist working within the Roman empire, showed that pressing on the heart in human subjects did not lead to loss of consciousness or loss of sensation but severing the spinal cord in animals abolished sensory responses after brain stimulation.

The ideas of the Greeks from centuries B.C. were perpetuated and preserved by the writings and drawings of the Arab world until well into the middle ages A.D.. Thus, one of the earliest diagrams of the eye was from an ancient Arab manuscript (circa A.D. 860) and this was probably a copy of an older Greek illustration now lost (Fig. 2, below) (Polyak, 1957).
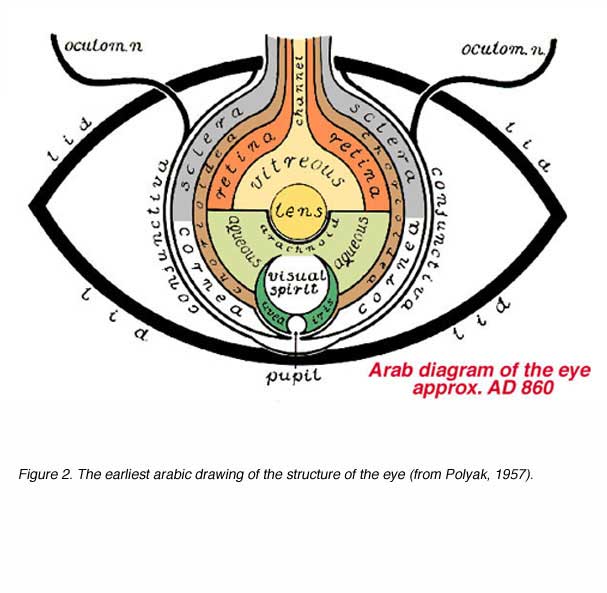
According to early ideas, the eye had a central crystalline lens which had a photoreceptor role. Furthermore, the belief was that the optic nerve was hollow and that a mysterious visual spirit existed in front of the lens (Fig. 2). Interestingly, the general theory advanced by the majority of Greek anatomists was that the retina, because of its abundant blood vessels, was an organ of nutrition rather than of sight, although one Greek, Galen, hypothesized correctly, as we now know, that the retina was a displaced part of the brain. It was not until the 12th century A.D, that a Moor scientist, Averroes, living in Spain, proposed that the retina and not the lens was the visual receptor (Jung, 1984). And it was not until 500 years after Galen that Kepler and others expanded on this principle.
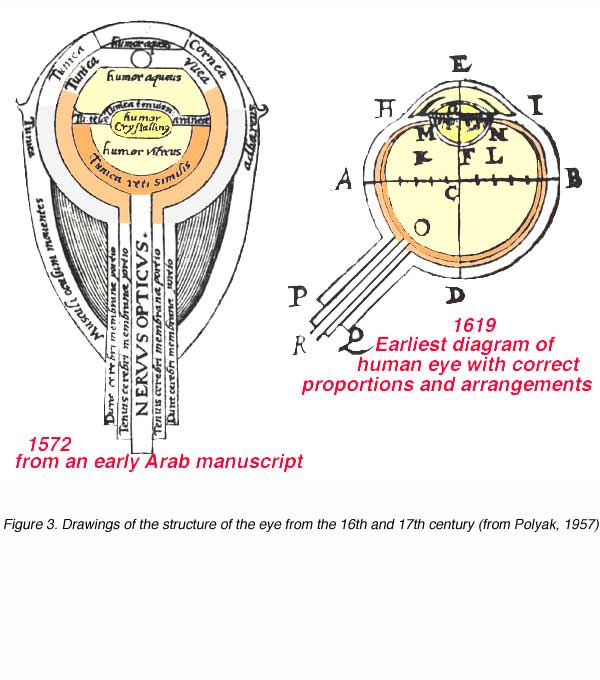
Our knowledge of the eye continued to show the Arab influence up until the 16th century (Fig. 3, left). Even the great anatomist and artist Leonardo da Vinci (1452-1519) based his anatomical sketches of the eye on the older incorrect Arab drawings. Leonardo was convinced that the image was formed in the eye but did not know how, and for the good reason that, there was still not yet an understanding of physiological optics. In fact, it was not until the early 17th century that more correct drawings of the eye were made independently by the little known anatomists and scientists, Girolamo Fabrizzi d’Aquapendente and Christopher Scheiner (Fig. 3, below) (Polyak, 1957). By this time, the Swiss anatomist, Platter in 1583, had proposed that the role of the lens was to collect light rays and the retina was the photoreceptor .
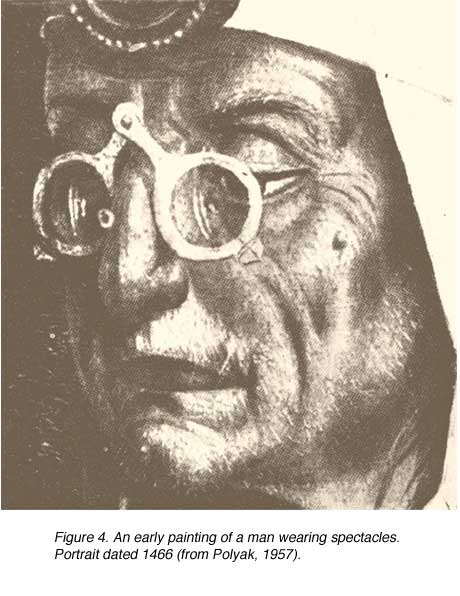
 Again it was the early Greek physicists (Euclid, Archimedes and Ptolemy) that hypothesized concerning the fundamental properties of light: that light traveled in straight lines and could be reflected from polished planes and curved mirrors. It seems likely that the Greeks and then the Romans used polished glass as early magnifiers. These items were preserved in the lava covering the destroyed city of Pompeii (destroyed AD 79). There is little evidence for any real design of spectacles though, until about the 13th century A.D.. One of the earliest depictions of spectacles to correct eyesight (Fig. 4) is shown in a man’s portrait found in a church at Rothenburgh, Germany, dating from the year 1466 (Polyak, 1957).
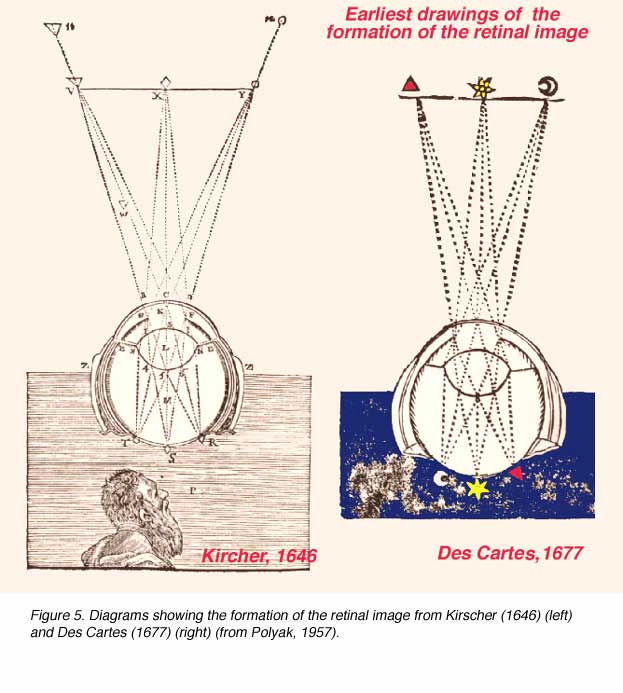
Johannes Kepler (1571-1630) in his Dioptrice established the principle of dioptrics fundamental to an understanding of how the image is formed in the eye. He understood that the cornea and lens collected and refracted the light rays and that the image was “painted” on the retina as an aggregation of many image points. Kepler was also able to explain presbyopia and myopia. Kepler was indeed the father of the science of optics (Polyak, 1957). Subsequently, many great scientists, including Rene des Cartes (1596-1650) (Fig. 5) and Sir Isaac Newton (1642-1727) with their work put the study of optics and ocular dioptrics on a solid scientific foundation, from which stems all our modern knowledge of how the eye functions and the visual image is formed.
Perceptual studies of how we see became possible as a result of the development of mathematical formulae, and other measuring techniques proposed in the early 17th century. They include Newton’s great discovery of the spectrum which is the foundation for the study of color vision (Jung, 1984). The discipline, known as psychophysics [psycho = perception and physics = physical nature of the stimulus] is an essential discipline for probing perception. In the chapter that follows, we outline common psychophysical procedures and methods in use today, likely to be encountered in vision science, optometry and ophthalmology.
2. Measurement of Light
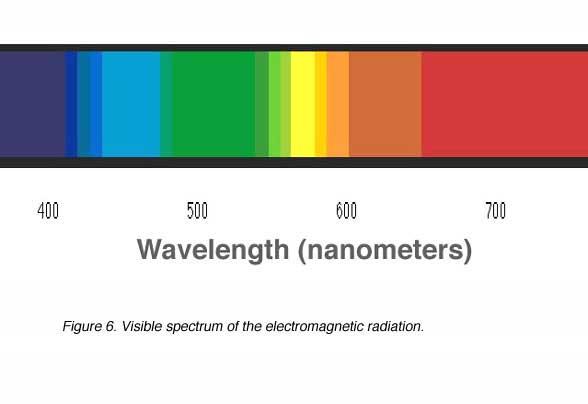
Light can be measured and specified in two units: radiometric units and photometric units. We consider ‘light’ to be a form of visible electromagnetic radiation. It is part of the electromagnetic spectrum between the wavelengths of 380 nm (blue light) and 750nm (red light) (Fig. 6). Electromagnetic radiation is emitted from a source in small packets of energy called quanta or photons.
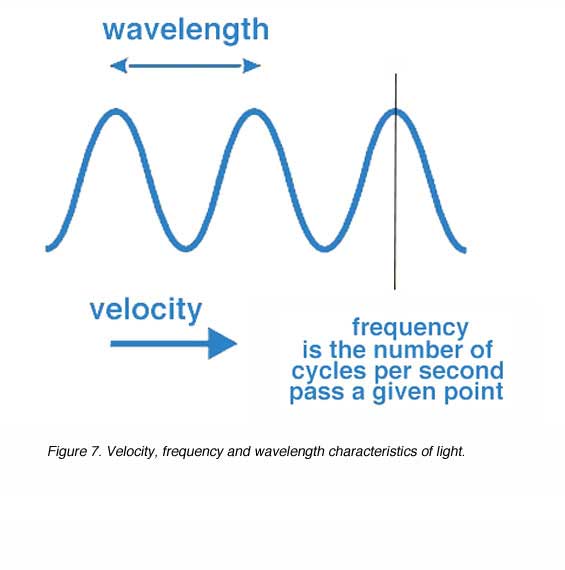
In a vacuum, a photon travels at a velocity of 3 x 10⁸ m/sec. The velocity, frequency (cycles/vibrations per second of the photon) and the wavelength is related by this equation.
Equation 1: c = nl
where c is the velocity of light in a vacuum (e.g. m/s), n is the frequency in Hertz (e.g. cycles per second) and l is the wavelength (e.g. in metres). See figure 7 for this relationship. It is important to note that the frequency is inversely proportional to the wavelength as the velocity of light is fixed.
The velocity of light in a vacuum (c) is higher than in any other medium (Vm). Therefore, the refractive index in any given medium (nm), is defined as the ratio of the two velocities. Furthermore, for any given frequency, the wavelength in a vacuum, (λc) and the wavelength in a medium, (λm), gives the refractive index.
Equation 2: nm = c/Vm = λc/λm
Energy and frequency of the photon can be related using Einstein’s equation.
Equation 3: E = hν
where E is the energy in Joules, h is Planck’s constant (6.624 x 10⁻³⁴ joule·sec) and ν is the frequency in Hertz (cycles per second of the photon). The unit for energy is joules (J).
As frequency is inversely proportional to its wavelength.=
Equation 4: ν = c/λ
where λ is the wavelength in metres and ν is the frequency in Hertz (cycles per second of the photon).
The above two equations can be combined to give.
Equation 5: E = hc/λ
or
Equation 6: E= hVm/λm
This fundamental equation is important in relating energy and wavelength of light. Because energy and wavelength are inversely proportional, this implies that short wavelength photons have higher energy. Furthermore it is important to bear in mind that it is only photon energy and frequency which are conserved when light passes from one medium to another.
Another important term is power. Power is defined as the rate of work done, that is, the amount of work or energy output over a given time. The watt (W) is the SI unit for power. One watt is equivalent to one joule per second.
Radiometry
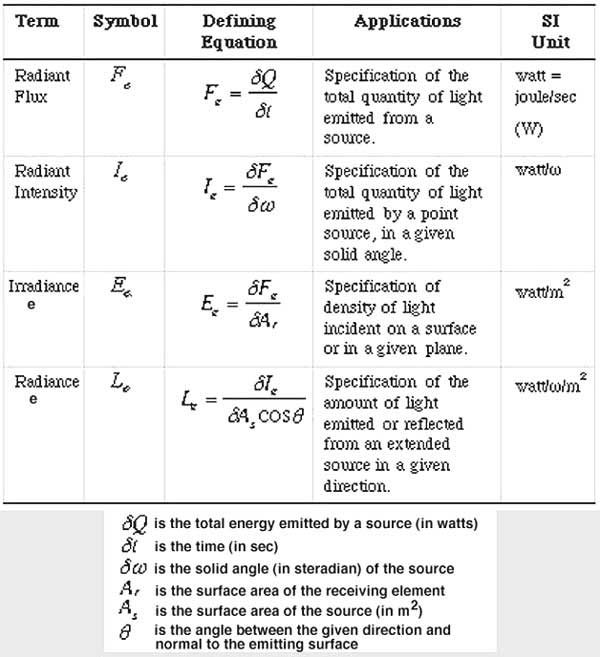
There are two parallel sets of units for measuring light. One is based on the psychophysical impact of the light on a human observer, the other on detection by physical radiometric devices. The two units are interconvertible, but sometimes only with difficulty. Measurement of light energy from a source can be specified in radiometric units. Radiometric units specify the amount of radiant energy present in light. See Table 1 for radiometric concepts and SI units.
All light measurement is derived from radiant flux. Subsequently, radiometric units are defined with respect to direction and surface, and all photometric units are derived from radiometric units using the photopic luminous efficiency functions or the scotopic luminous efficiency function.
There are two main ways in which energy produces photons, incandescent and luminescent. These correspond to thermal and non-thermal mechanisms, respectively. With incandescence, photons are released from thermally agitated electrons. The frequency of photons from this type of radiation is relatively wide and continuous regardless of the substance, with a spectrum dependent only on temperature. Luminescence involves electron excitation in an atom, molecule or crystal. Emission of photons results from the energy given up by the electron as it moves from one excitation shell to another. The frequency of the photon emission has a pattern characteristic of the substance.
Luminescent production of photons can be achieved in a gas discharge tube. These tubes contain gas vapour such as sodium, mercury or neon. Electrons are accelerated from one electrode to the other in these tubes. These high velocity electrons bombard the gas atoms and causes a displacement of electrons. When the electrons return to the normal state, this excitation energy is emitted as photons. Neon and mercury sources are often used in optics.
Fluorescence is another example of luminescence. In fluorescenttubes, electrons collide with atoms of mercury, resulting in a quanta of ultraviolet light being emitted. Part of the energy of the ultraviolet quanta is absorbed by the phosphor coating of the tube and subsequently releases a quanta of light in the visible spectrum.
A tungsten filament lamp is an example of incandescence. Tungsten spectral emission resembles that of a black body. A black body is a theoretically perfect radiator. As the energy is increased, the spectral emission changes. Colour temperature is a term used when the colour of the radiator is the same colour as the black body at a certain temperature (measured in Kelvin). For example, a black body with a temperature of 2700K would have a similar colour to tungsten, therefore, tungsten is said to have a colour temperature of 2700K.
Photometry
Photometry is the measurement and specification of light relating to its effect on vision. The eye can be regarded as a radiant energy detector with a selective spectral response. In a well lit environment it is maximally sensitive to light of about 555 nm (yellow-green light) and relatively insensitive to far red and blue light. The function describing the response of the human eye to different wavelengths is known as the relative luminous efficiency function.
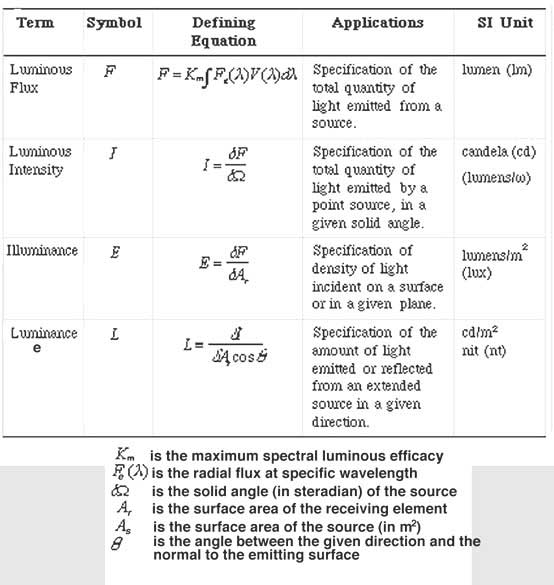
Measurement of light from a source can be specified in photometric units. Photometric units take into account both the quantity of radiant energy and sensitivity of the eye, to the wavelength(s) of the radiation. In other words, the photometric quantities specify the capacity of radiant energy to evoke a visual response. See Table 2 for photometric concept and SI units.
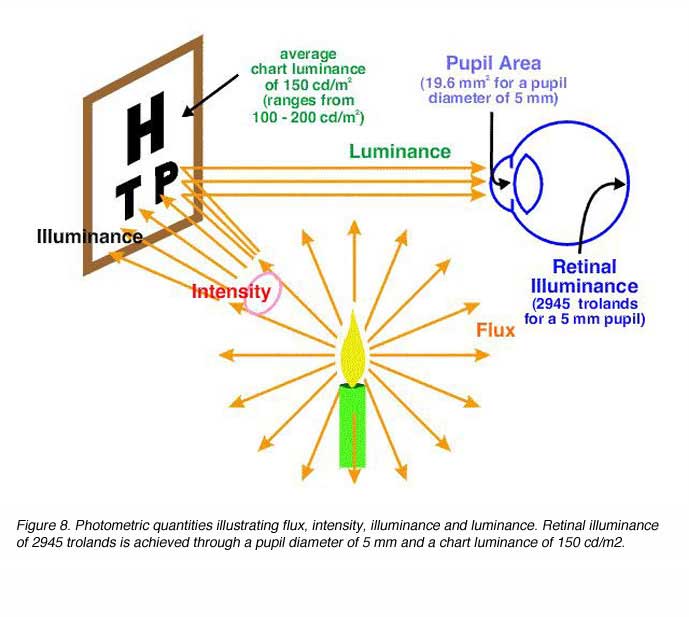
All light measurement is derived from radiant flux, converted to luminous flux. As with radiometric units, subsequent photometric units are also defined with respect to direction and surface (Fig. 8).
A patient’s visual fields are commonly examined in clinical practice. The luminance of the background (bowl) of the visual field analyser are as follows: 1) Humphrey automated visual field analyser, 10 cd/m2. 2) Goldmann visual field analyser, 4 cd/m2 and 3) the Medmont automated visual field analyser, 4 cd/m2. From these values, retinal illuminance can be calculated. Also, from table 3 (below) we can see that the luminance of the visual field analysis places the patient just above mesopic light levels.
V(λ) versus V'(λ) is the relative luminous efficiency function used to describe the response of the human eye to different wavelengths. The values used are those defined by the International Commission of Illumination (CIE) for a standard observer, as adopted in 1924 (for photopic vision) and 1951 (for scotopic vision). Thus, the photometric quantity of luminous flux is given by the equations below (Equation 7 for photopic and Equation 8 for scotopic conditions).
Equation 7: F = Km Fe(λ) V(λ) d λ
and
Equation 8: Fs = K’m Fe(λ) V'(λ) d λ
where Fe(λ) is the corresponding radiometric quantity (in this case radiant flux) and V(λ) is a luminous efficiency constant (which equals 683 lm/W for photopic conditions and 1700 lm/W for scotopic conditions), and Km is a luminous efficiency constant. Equation 8 outlines scotopic flux (Fs) in scotopic lumens from which other scotopic units, such as scotopic troland can be obtained. Convention dictates that unless otherwise stated, all units are photopic quantities.
A candela is the unit for luminous intensity. In a given direction, it is defined as a source which emits monochromatic radiant energy of frequency 540 x 1012 Hertz and whose radiant intensity is 1/683 watts per steradian in that direction.
A lumen (unit of luminous flux) is the luminous flux emitted within a unit solid angle (one steradian), by a point source having a uniform luminous intensity of one candela. Therefore, a lumen can be defined as the luminous flux of monochromatic radiant energy whose radiant flux is 1/683 watt and whose frequency is 540 x1012 Hertz (converts to 555 nm in air). The definition for a candle at 555 nm is identical for scotopic and photopic system.
Consequently, the peak of the two functions will be different, as shown in figure 9. The amount of light required to stimulate the eye under scotopic conditions is much less than under photopic condition (Fig. 9). The difference in absolute sensitivity is reflected by the different constants, Km and K’m values for the photopic and scotopic luminous efficacy, respectively.
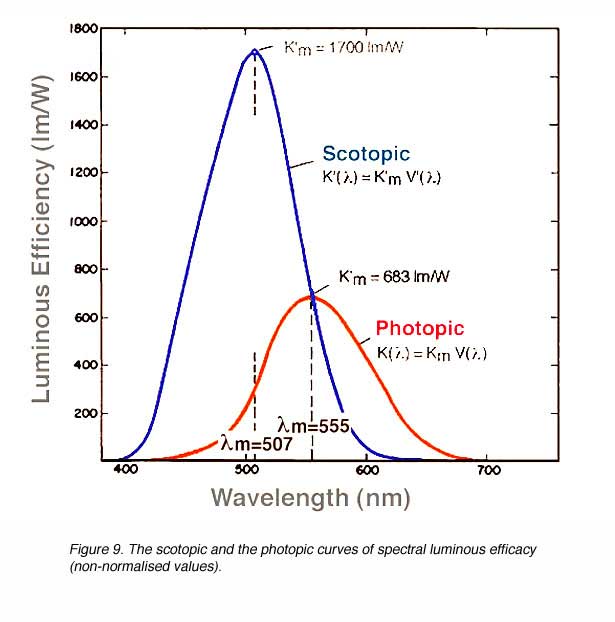
Figure 10 shows normalised data, where the maximum value is set at 1 for comparison. Therefore, the curves peak at the same level. To set the maximum at unity, the constants, Km and K’m which correspond to the peaks of the photopic and scotopic luminous efficacy curve respectively, are used. These constants are used to relate back to the actual photopic luminous efficacy, K(λ), and actual scotopic luminous efficacy, K'(λ). The relationship between K(λ), V(λ) and Km are given below.
K(λ) = Km V(λ) and K'(λ) = K’mV'(λ)

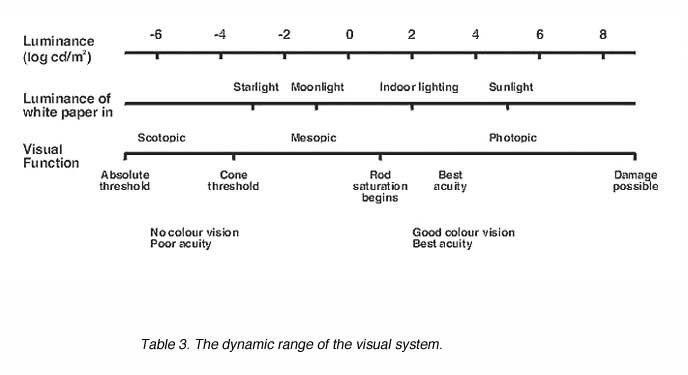
The visual system is sensitive over a wide range of luminance. Table 3 illustrates this range. The top row shows luminances which extend from the minimum required for detection to levels at which damage to the visual system is possible. The second row relates the luminance to familiar viewing conditions by indicating the luminance of white paper under illumination from starlight to sunlight. Finally, the bottom row links the physical stimulus to a variety of visual functions. When patients are asked to read the chart to measure their visual acuity as in Figure 3, their visual system is functioning in the low photopic range.
SI (International Standard) units should always be used when reporting photometric quantities (Table 4). See the Units and Conversion Tables (Table 4) for conversion factors for some common (and not-so-common) non-SI. To convert to SI units, multiply the non-SI unit by the conversion factor. The best source of light measurement units is from the Light Measurements Handbook on the website http://www.intl-light.com.

A convenient measure of retinal illuminance is based on the unit of the troland. One troland (Td) of retinal illuminance is produced by an extended source of 1 cd/m2 seen through a pupil of 1 mm2. Thus retinal illuminance E in trolands is given by Equation 9.
Equation 9: E = LA
where L is the luminance in cd/m2 and A is pupil area in mm2. Thus the unit for troland is cd/m2.mm2. If scotopic units are used, luminance is defined as scotopic cd/m2, and the troland is called a scotopic troland.
Inverse Square Law
The illuminance (E) of a surface due to a point source of light is proportional to the luminous intensity (I) of the source in the direction of that surface and inversely proportional to the square of the distance (d) between the surface and the source. The angle θ is the angle of incidence.
Equation 10: E = I/d2. cos θ
Remember, the rule of thumb for all laws dealing with light measurement is that radiation is derived from a point source. For practical purposes a source is considered to be a point source when the distance from the source is greater that five times its diameter.
Luminance and Illuminance calculations
When light falls on a surface, the luminance from this surface is proportional to its reflectance and the angle of incidence.
Equation 11: L= Er/π·cos θ
where L is luminance of the surface (cd/m2), E is the illuminance (lux), r is the reflectance and θ is the angle of incidence of the luminous flux.
Filters
Neutral density filters are used to decrease the transmittance. Transmittance is calculated using the following formulas.
Equation 12: T = L/Lo
Where L is luminance of the source with no filter in place and Lo is the luminance of the source with the filter. The optical density of the filters is given by Equation 13.
Equation 13: D = -log10T
Where T is the transmittance.
According to Beer’s law, the optical density of a solution is given by:
Equation 14: D = a e l
Where a is the concentration of the solution in gram-molecules per litre, e is the molar extinction coefficient and l is the path length in cm. Equations 13 and 14 can be equated to relate Beer’s law to transmittance.
In visual field measures, the attenuation of light from the maximum available is expressed in decibel (dB) values. For example, in the Humphrey Visual Field analyser, the luminance of the light can be modulated over a 5.1 log unit range (i.e., 51dB where 0.1 log unit of attenuation = 1 dB). The maximum brightness spot is 3,183 cd/m2, and when it is attenuated with 51dB filter, it has a luminance of 0.025 cd/m2.
3. Psychophysical Measurements
Psychophysical methods and procedures are useful in determining threshold, including visual field analysis. For a perfect observer, threshold is the point where the stimulus can just be detected or where you just cannot detect the stimulus. Humans are not perfect observers, and often thresholds are defined in probabilistic terms: for example, half the points presented would be detected and half would not. So under certain psychophysical techniques, threshold can be considered the point where 50% of the stimuli are detected. Threshold variability most likely depends on neural noise. One aspect of visual psychophysics deals with noise and is termed, Signal Detection Theory, but this will not be covered here.
Measurement of visual response can be achieved through several methods. These methods include the, 1) Method of Adjustment, 2) Method of Limits, 3) Staircase (modified Method of limits) and 4) Method of Constant Stimuli.
The method of adjustment involves asking the subject to either increase the stimulus intensity from non-seeing until the stimulus can just be seen or to decrease the stimulus intensity until the stimulus has just disappeared. This method also suffers from both errors of habituation and anticipation (these two errors are discussed below) but is useful to obtain an estimate of threshold that can be investigated with more complex techniques. See Fig. 11.
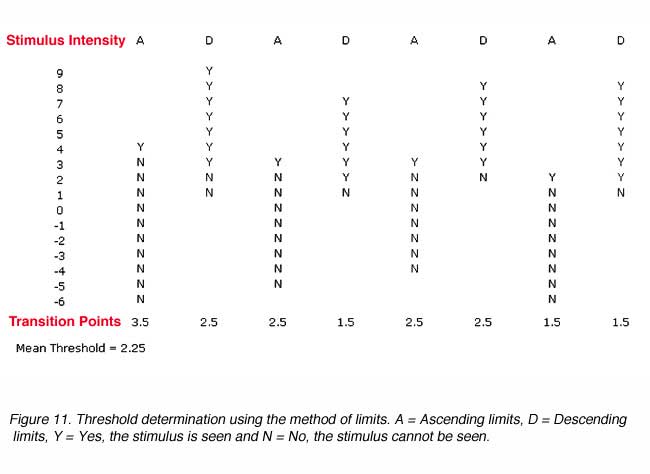
The method of limits involves presenting a stimulus well above threshold and decreasing the stimulus intensity in small steps until the subject cannot detect the stimulus (threshold). This is called descending limits. Ascending limits is when a stimulus is first presented well below threshold, then the stimulus intensity is increased to reach threshold. Ascending limits and descending limits are used to estimate the threshold. Threshold is considered the average of the threshold points estimated by several ascending and descending limits (Fig. 11).
Ascending and descending limits is a quick method of determining threshold, however, like the method of adjustment, two errors can occur; the errors of habituation and the errors of anticipation. The error of habituation occur when subjects develop a habit of responding to a stimulus. For example, in ascending limits, the subject may respond to seeing the stimulus three steps past the threshold every time, thus giving a false threshold point. The error of anticipation occurs when subjects prematurely report seeing the stimulus before the threshold has been reached. Clear instructions, demonstrations and practice runs can reduce the errors of habituation. Errors of anticipation can be minimised by changing the starting intensity for each trial.
A variation of the method of limits is the staircase method which involves both the ascending and descending limits in a trial. Stimulus intensity is progressively increased (ascending limits) until the subject reports seeing the stimulus. At this point, the intensity value is recorded and the stimulus intensity is then progressively reduced (descending limits), until the subject reports not seeing the stimulus. Threshold is considered the average of several of these reversal points. See figure 12. Threshold estimates using this methods are also prone to the errors noted above and consequently, multiple simultaneous staircases are used to minimise such errors.
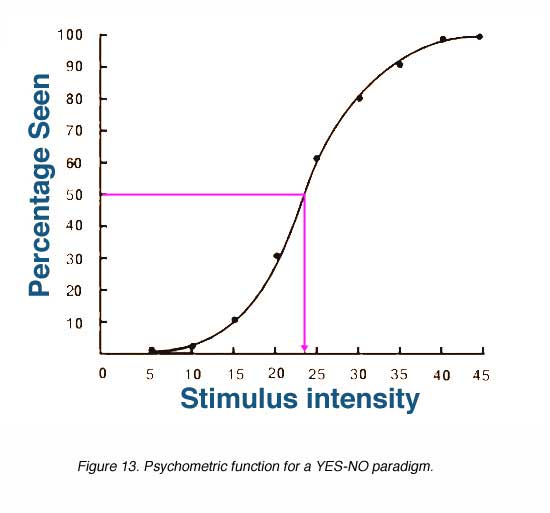
 The method of constant stimuli involves the repeated presentation of a number of stimuli. The threshold value of 50% lies somewhere within this range. Other psychophysical techniques are used to estimate threshold and determine stimuli intensities to be used for presentation. These stimuli are randomly presented. The percentage of detection is determined as a function of stimulus intensity. Some high intensity points will always be detected while other low intensity points will never to detected. The percentage of detection versus the stimulus intensity is graphed in Figure 13. This graph is called the psychometric function and looks like an S shaped curve sometimes referred to as an ogive. The threshold value is defined as the value where 50% of the stimuli are detected. Thus the threshold for the data below is 23.5.
Psychophysical procedures are used to minimise the variability in obtaining threshold by requiring subjects to commit to an answer.
The YES-NO PROCEDURE involves the subject judging the presence or absence of the signal. A stimulus is presented, during which the subject has to make a yes or no response. Correct response can range from 0% to 100% as shown in figure 13.
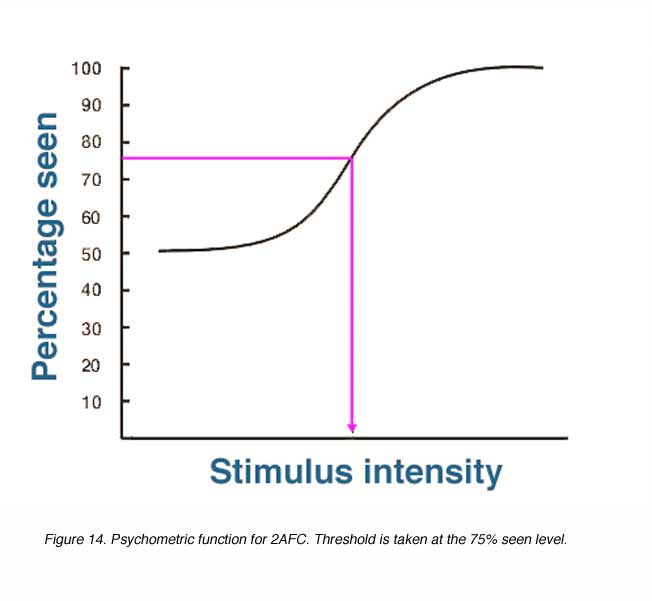
The FORCED CHOICE PROCEDURE involves forcing the subject to choose from alternative choices, one of which contains the stimulus. A two-alternative forced choice (2AFC) describes a subject choosing between two alternatives. Choosing from four alternatives and six alternatives are called 4AFC and 6AFC, respectively. The percentage correct for the various stimuli intensities can be used to construct a psychometric function to determine threshold. As there is already a 50% chance of a correct response with 2AFC, threshold is commonly considered as 75% (See Fig. 14).
For a 4AFC, threshold is considered to be at the 62.5% seen level, as this is half way between 25% and 100%. The ogive starts at 25% because there is already a 25% chance of a correct response with 4AFC as shown in Figure 15.

4. Adaptive Psychophysical Methods
ADAPTATIVE METHODS involve presenting signals based on the performance of the subjects previous response while in FORCED CHOICE TRACKING a forced choice procedure is used. When subjects correctly respond three times, stimulus intensity is decreased by one step. An incorrect response will result in a one step increase in stimulus intensity. The size of the ascending and descending steps remain the same throughout the session. The session ends when a narrow range of stimuli level is reached. Threshold is considered the average of the intensity level within the period of stable tracking.
The size of the steps is an important factor. If the steps are too small, the subject may not be able to discern differences in intensity. Reaching the threshold range with small steps will also be time consuming. Large steps may miss the threshold range altogether, with swings from well above threshold to well below threshold.
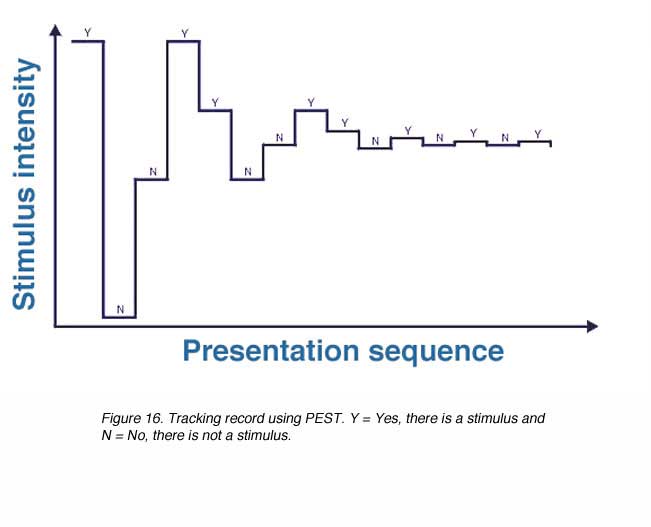
PARAMETER ESTIMATION BY SEQUENTIAL TESTING (PEST) was designed to address the problem of step size and starting intensity. PEST techniques begin the session with large steps (large changes in intensity) with the intensity progressively halved until the smallest specified step to determine threshold (see Fig. 16). PEST is actually a little more complicated than explained here.
MAXIMUM LIKELIHOOD METHODS. With both forced choice tracking and PEST, subsequent changes in stimulus intensity relies on the subjects previous two or three responses. In maximum likelihood methods, the stimulus intensity presented at each trial is determined by statistical estimation of the subjects threshold based on all responses from the beginning of the session. After each trial, a new estimation of threshold is determined and the stimulus intensity is adjusted accordingly. Threshold is taken at the point where there is little change in stimulus intensity.
Several examples of maximum likelihood methods are QUEST (quick estimate by sequential testing), ZEST (zippy estimate of sequential testing), and SITA (Swedish interactive threshold algorithm – which is a modified ZEST). These methods require prior information about the population’s distribution of threshold and is used to construct a probability distribution function (PDF). Prior PDF is based on previously published data, pilot studies or the expectations of the experimenter. Based on the PDF, the mode (QUEST) or the mean (ZEST) stimulus intensity that is most likely to be the subject’s threshold is presented. The subject’s response is then used to construct a new PDF using Bayes’ rule of combining probability. The next stimulus intensity is presented at the new level that is most likely threshold. At the end of the procedure, the mode (QUEST) or the mean (ZEST) of the final PDF is considered the best estimate of the subject’s threshold.
References
- Geischeider, G.A. (1997) Psychophysics: The Fundamentals. 3rd ed. New Jersey: Lawrence Erlbaum Associates, Inc., Publishers.
- Graham C.H. (1965) Vision and Visual Perception. New York: John Wiley and Sons, Inc.
- Jung R (1984) Sensory research in historical perspective: some philosophical foundations of perception. In, Handbook of Physiology, Edited by Ian Darian-Smith, American Physiological Society, Bethesda, Maryland, pp. 1-74.
- Polyak, S. (1957) The Vertebrate Visual System. Univ. Chicago Press, Chicago.
- Schwartz S.H. (1999) Visual Perception: a clinical orientation. 2nd ed. Connecticut. Appleton and Lange.
- Wyszecki G. and Stiles W.S. (1982) Color Science: Concepts and Methods, Quantitative Data and Formulae, 2nd ed. New York: John Wiley and Sons, Inc.
The autor
Michael Kalloniatis was born in Athens Greece in 1958. He received his optometry degree and Master’s degree from the University of Melbourne. His PhD was awarded from the University of Houston, College of Optometry, for studies investigating colour vision processing in the monkey visual system. Post-doctoral training continued at the University of Texas in Houston with Dr Robert Marc. It was during this period that he developed a keen interest in retinal neurochemistry, but he also maintains an active research laboratory in visual psychophysics focussing on colour vision and visual adaptation. He was a faculty member of the Department of Optometry and Vision Sciences at the University of Melbourne for some years, moved to New Zealandas the Robert G. Leitl Professor of Optometry, Department of Optometry and Vision Science, University of Auckland. Since 2008 Mike has returned to Syney, Australia as a Faculty member at the University of New South Wale, and is now Director, Centre for Eye Health, an initiative of Guide Dogs NSW/ACT and the University of New South Wales (UNSW). E-mail to m.kalloniatis@unsw.edu.au
Charles Luu was born in Can Tho, Vietnam in 1974. He was educated in Melbourne and received his optometry degree from the University of Melbourne in 1996 and proceeded to undertake a clinical residency within the Victorian College of Optometry. During this period, he completed post-graduate training and was awarded the post-graduate diploma in clinical optometry. His areas of expertise include low vision and contact lenses. During his tenure as a staff optometrist, he undertook teaching of optometry students as well as putting together the “Cyclopean Eye”, in collaboration with Dr Michael Kalloniatis. The Cyclopean Eye is a Web based interactive unit used in undergraduate teaching of vision science to optometry students. He is currently in private optometric practice as well as a visiting clinician within the Department of Optometry and Vision Science, University of Melbourne.